
Route Based Vibration Data Collector
The Crystal Instruments CoCo series are portable devices for vibration monitoring and predictive maintenance applications. The system consists of a CoCo analyzer and the Engineering Data Management (EDM) software. The CoCo is used to make field measurements and the EDM software in Vibration Data Collector (VDC) Mode is used to setup the CoCo hardware and define routes before field measurements, and to download data from the CoCo to analyze and archive afterwards.
EDM has a unique user interface that emphasizes graphical tools. The layout can be configured and customized to meet your specific needs. The software has been designed to make using the CoCo a streamlined process that makes measuring, analyzing, and documenting your work easier than ever.
The CoCo hardware platform supports two different software working modes: Dynamic Signal Analyzer (DSA) and Vibration Data Collector (VDC). Each working mode has its own user interface and navigation structure. DSA mode is designed for mechanical structure analysis, testing and optimization, electrical, geophysics, and a wide range of other applications. VDC mode is dedicated to route-based machine condition monitoring, vibration data collection, and trending.
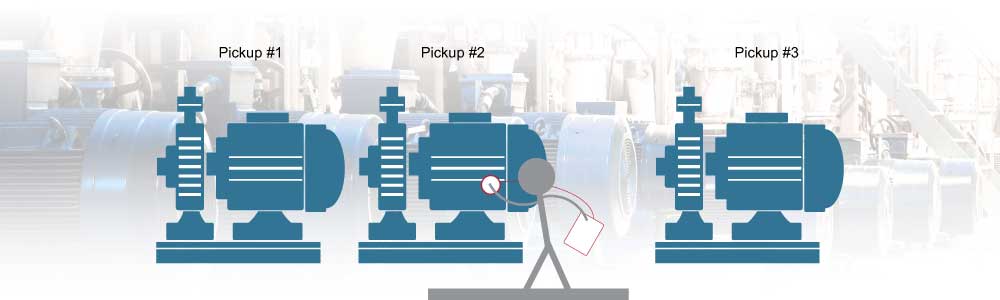
Typical workflow for Vibration Data Collector: Create/Maintain Database > Data Collection Route > Upload Route from PC to CoCo > Make Measurements > Analyze, Report and Archive Data.


Route Based Condition Monitoring
Measurement Channels: 1 or 3 channels (tri-axis) with tachometer enabled or disabled
Route Collection Control: Easy navigation from the UI level to routes. View or hold live signals, review saved data, previous measurement entry, next measurement entry, previous point, next point, point and route management
Demodulated Spectrum
Available in both route collection and onsite mode
Demodulation Bandwidth: 24 bandwidth options ranging from 125 Hz -1.44 kHz, to 32 kHz - 46.08 kHz
Coast-Down/Run-Up
Trigger setting to collect data when increasing (run-up) or decreasing (coastdown) speed. 3D display for order spectrum data.
Rotor Balancing
Enables users to correct the imbalance without dismantling the machine. It is possible to balance rotors of any size with either 1 or 2 plane balancing. Using the multiple channel option, parallel measurements on 2 sensors are possible, resulting in a faster, safer, and more accurate procedure. The user interface allows stopping and starting balancing as needed and to repeat any single operation without repeating the whole procedure.
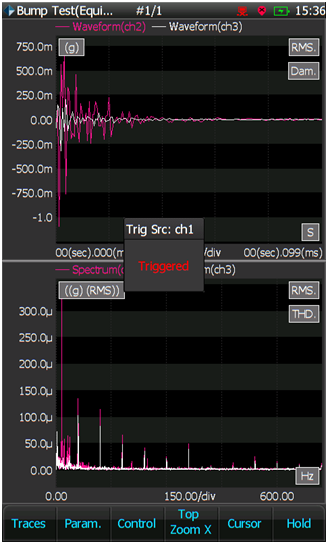
Bump Test
Auto power spectra within user-defined frequency band.

Zoom Spectrum Analysis
Increase resolution in the bandwidth of interest. Zoom Spectrum Analysis allows for higher resolution measurements to be made by focusing on a section of the available bandwidth. All available spectral lines are distributed across the selected bandwidth, rather than across the entire available frequency range. Compute FRF, Coherence, Auto Power Spectra, and Phase Spectra.

Tri-Axis Signal Display
A new signal display allows for viewing 3 separate time traces in VDC mode. This allows users to see all three axes in a tri-axial measurement.