
FFT Spectral Analysis
Fast Fourier Transform (FFT) spectral analysis uses Digital Signal Processing theory applications such as Auto Power Spectrum, Cross Power Spectrum, Fourier Transform, and related calculations. This function is included in the Dynamic Signal Analyzer category.
Power Spectrum
The magnitudes of signal frequency components are collectively referred to as amplitude spectrums. In many applications, the quantity of interest is the power or rate of energy transfer that is proportional to the squared magnitude of frequency components. The squared magnitudes of all the Discrete Fourier Transform (DFT) frequency lines are collectively referred to as the Power Spectrum.

Cross Spectrum
The Cross Spectrum characterizes the relationship between the spectra of two signals. The signals 𝑥 and 𝑦 with frequency components 𝑆x and 𝑆y are defined as:

The correlation between the frequency components of two related signals is described by the preceding equation. The Power Spectrum is real-valued, and the Cross Spectrum is complex. This also describes the phase alignment of the two signals.
Frequency Response Function
An important application of Dynamic Signal Analysis is to characterize the input-output behavior of physical systems. This is the domain of network analysis. Linear systems can predict the output from a known input if the Frequency Response Function value is defined. The Frequency Response Function (f) relates the Fourier Transform of the output Y(f) to the Fourier Transform of the input Y(f) according to the following simple equation.
𝑌(𝑓)= 𝐻(𝑓)𝑋(𝑓)
The system is linear because H(f) is independent of the input. When measuring the input-output behavior of a system, noise is always present to obscure the output. An important measure is how much of the output is caused by the input. Coherence is another correlation measure, and it is defined as:
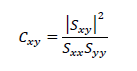
The coherence is between 0 and 1. A result of 1 confirms the output is perfectly explained by the input. A coherence of 0 indicates the output and input are uncorrelated.
FFT Parameters
Block Size/Lines defines the size of the time blocks as the number of samples and spectral lines used in the frequency domain of the Fourier Transform for a signal. The duration of a time block is calculated as follows:

Increasing the block size increases the resolution of the frequency transform and allows detection of lower frequencies. However, the calculation time and response time is also increased.
The ratio between lines and block size is determined by the characteristics of the A/D converter and anti-aliasing filter. In general, a ratio of 0.439 means that a time block of 1,024 samples results in approximately 0.439 * 1,024 = 450 lines in the spectrum.
Overlap Ratio sets the proportion of overlapped samples in time blocks when calculating the FFT. Higher overlap ratios result in faster response times but increases processing requirements. The overlap ratio options are no overlap, 25%, 50%, 75%, 80%, 87.5%, 90%, 95% and “as high as possible”.
Average Mode provides options such as exponential, linear, moving linear, and peak hold as methods to average the spectrum signals.
Average Number is the number of blocks that are averaged for the signal spectrum. Increasing the number of averages reduces the variance of the signal spectrum.
Window allows users to choose a window to apply during FFT operation. Windowing functions can help reduce leakage and increase the precision of the frequency measurement. Detailed descriptions about window types and average modes are provided in the DSA Basics document.
Start Average Frame defines from which frame the average function starts.