
Time waveform recording solutions - portable & high channel
Time Waveform Recording
Time Data Acquisition Software and Hardware
Establishing a time record of data is a critical requirement of vibration testing. Whether the application is ground vibration monitoring of railway activity or laboratory testing of a missile fixture, time recording can reveal important data. Times of peak activity, the overall vibration level at various times, the damping ratio, or other useful information is uncovered from acquired time data. Acquired vibration data might need synchronization with other data types. Crystal Instruments offers a variety of solutions to fulfill any time data acquisition need.
Time data acquisition requires users to understand the constraints and specifications of an application to select the correct data acquisition platform. Explore Crystal Instruments’ solutions to four key questions below.
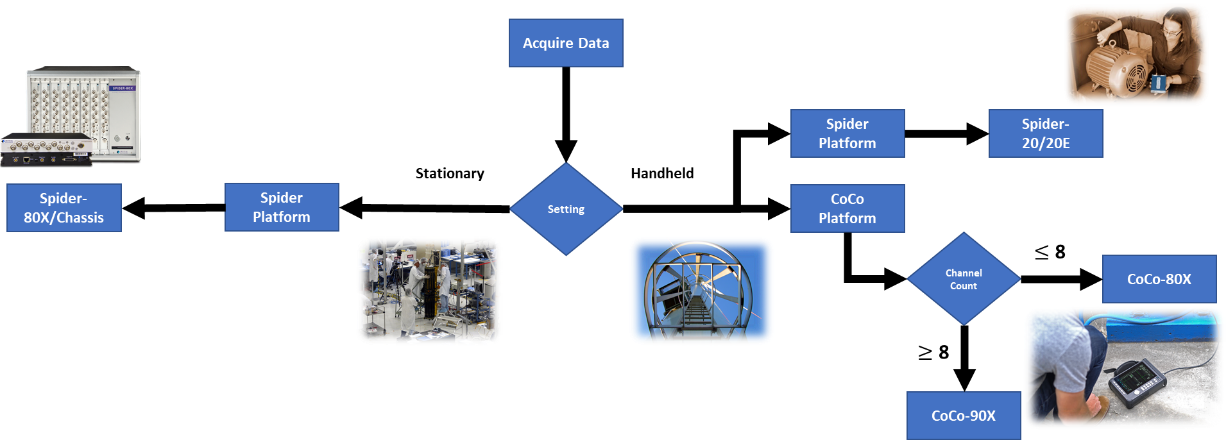
1. What hardware do I choose?
For any application, choosing a data acquisition platform that is compatible with the application environment is crucial. Crystal Instruments has a variety of hardware platforms to meet the demands of any environment and to satisfy the balance of application constraints vs. required features.
The form factor, overall size, and other criteria for the Crystal Instruments hardware line is listed in the table below:
The capabilities of the features outweigh the limits of application constraints.
| Hardware Platform | Spider-80X V2 | Spider-80Xi | Spider-80SGi | Spider-80Ti | Spider-20HE/20i | CoCo-70X | CoCo-80X | CoCo-90X |
|---|---|---|---|---|---|---|---|---|
| Portable | Yes | Yes - handheld | ||||||
| Ruggedized | No | Request (IP-53) | Yes (IP-67) | Yes (IP-31) | Yes (IP-31) | |||
| Interface | PC/Black Box Mode + Buttons | Screen + Buttons | Touchscreen + Buttons | |||||
| Weight | 4.41 lbs / 2 kg | 4 slot: 18.1 lbs / 8.2 kg when 32 channels configured 8 slot: 26.6 lbs / 12.06 kg when 64 channels configured |
1.23 lbs / 0.56 kg (Spider-20E) 1.15 lbs / 0.52 kg (Spider-20i) |
3.64 lbs / 1.65 kg including battery | 5.0 lbs / 2.27 kg | 4.33 lbs / 1.96 kg | ||
| Size | 12.2 in / 310 mm x 9.45 in / 240 mm x 1.38 in / 35 mm (L x W x H) | 4 slot: 11.97 in / 304 mm x 7.63 in / 193.8 mm x 10.12 in / 257 mm (L x W x H) 8 slot: 11.97 in / 304 mm x 10.96 in / 278.4 mm x 10.12 in / 257 mm x (L x W x H) |
8 slot: 11.97 in / 304 mm x 10.96 in / 278.4 mm x 10.12 in / 257 mm x (L x W x H) 20i: 6.1 in / 155 mm x 4.315 in / 109.6 mm x 1.21 in / 30.7 mm (L x W x H) |
9.25 in / 235 mm x 7.4 in / 188 mm x 1.9 in / 48.26 mm (L X W X H) | 9.43 in / 239.6 mm x 7.44 in / 189 mm x 2.95 in / 75 mm (L X W X H) | 9.43 in / 239.6 mm x 7.44 in / 189 mm x 2.95 in / 75 mm (L X W X H) | ||
| Operational Temperature | 14°F / -10°C to 131°F / +55°C | -4°F / -20°C to 131°F / +55°C | 14°F / -10°C to 131°F / +55°C | -4°F / -20°C to 131°F / +55°C (LCD dims below -20°C) | ||||
| -20°C to +55°C (LCD dims below -20°C) | ||||||||
| Storage Temperature | -4°F / -20°C to 150°F / +70 °C | -4°F / -20°C to 150°F / +70 °C | -4°F / -20°C to 150°F / +70 °C | -4°F / -20°C to 150°F / +70 °C | -4°F / -20°C to 150°F / +70 °C | -4°F / -20°C to 150°F / +70 °C | ||
The most relevant electrical specifications for the Crystal Instruments’ hardware line are listed in the table below:
| Hardware Platform | Spider-80X V2 | Spider-80Xi | Spider-80SGi | Spider-80Ti | Spider-20HE/20i | CoCo-70X | CoCo-80X | CoCo-90X |
|---|---|---|---|---|---|---|---|---|
| Voltage or Power Supply | 15 VDC | 4 slot: 12 – 30 VDC 8 slot: 100 - 240 VAC (47 - 440 Hz) |
20HE: 15 VDC 20i: 12-24 VDC (±10%) |
15 V | ||||
| (±10%) | ||||||||
| Power Consumption | less than 15 W | 4 slot: less than 50 W when 32 channels are configured 8 slot: less than 90 W when 64 channels are configured |
Both: less than 6 W | 12 W | 14 W maximum, 8 W with LCD off | |||
| Battery Life | N/A | 4 slot: 4 hours with Spider-Battery provided | 20HE: 6 hours or longer in full operation | 7-9 hours | 6-8 hours | |||
CoCo supported sampling rates
The Crystal Instruments CoCo product line offers 54 different sampling rates:
| CoCo Supported Sampling Rates (highest to lowest) [Hz] | |||
|---|---|---|---|
| 102400 81920 64000 51200 40960 32000 25600 20480 16000 12800 10240 8000 6400 5120 |
4000 3200 2560 2000 1600 1280 1000 800 640 500 400 320 250 200 |
160 125 100 80 63 50 40 31 25 20 16 13 10 7.8 |
6.3 5 3.9 3.1 2.5 2 1.6 1.3 0.98 0.78 0.63 0.49 |
Spider supported sampling rates
The Crystal Instruments Spider product line supports a wide range of 58 different sampling frequencies:
| Spider Supported Sampling Rates (highest to lowest) [Hz] | |||
|---|---|---|---|
| 256000 204800 163840 128000 102400 81920 64000 51200 40960 32000 25600 20480 16000 12800 10240 |
8000 6400 5120 4000 3200 2560 2000 1600 1280 1000 800 640 500 400 320 |
250 200 160 125 100 80 62.5 50 40 31.25 25 20 15.625 12.5 |
10 7.813 6.25 5 3.906 3.125 2.5 1.953 1.563 1.25 0.977 0.781 0.625 0.488 |
Additionally, variable sampling rates can be configured for multi-module systems within the EDM software suite:
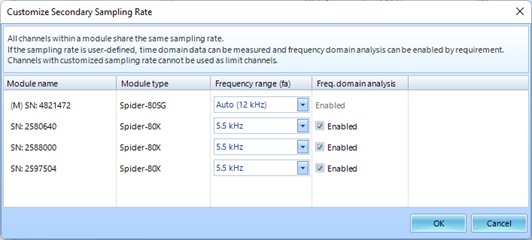
With just a few clicks, a secondary sampling rate can be set for your DAQ system.
For further details on FFT analysis parameters, read about our frequency response function capabilities.
2. What will I measure and how will I measure it?
The Spider and CoCo units can interface with several different sensor types, measure a wide variety of measurement quantities, and accommodate many different input modes.
| Sensor Types integrating with CoCo and Spider Hardware | |
|---|---|
| Acceleration | |
| Force | |
| Torque | |
| Pressure (refer to Scanivalve sensors table) | |
| Angular Velocity | |
| Displacement | |
| Magnetic Field | |
| Sound Pressure | |
| Strain | All bridge/rosette types |
| Custom rosette configurations [Spider] | |
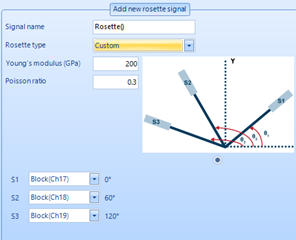 Custom rosette setting spares users from performing extra calculations after data is saved. |
|
| Sensor Models compatible with CoCo and Spider Hardware | |
|---|---|
| Acceleration | Dytran 7603B, 7503, 7523A2, Endevco 7264C, Kistler Type 8395A, DTS 6DX PRO series |
| Force | Omega LCM 901, Futek FFP350 |
| Torque | Omega TQ-130 Series, Futek TDD400, Futek TRS300, Futek TAT200, TAT420 |
| Pressure | Omega PX309 series, Measurement Spec EB100, Futek PMP927 |
| Angular Velocity | DTS ARS Pro-300, ARS Pro-1500, ARS Pro-8K, ARS Pro-18k |
| Displacement | Omega E2E-3DC Series |
| Magnetic Field |
Analog Devices AD22151 |
| Sound Pressure | InvenSense ICS40618 |
| Strain | Configurable as Quarter, Half or Full Bridge |
| Scanivalve - Crystal Instruments supports Scanivalve sensors for applications involving wind tunnels. The system integration and software setup is simple and convenient. | |
|---|---|
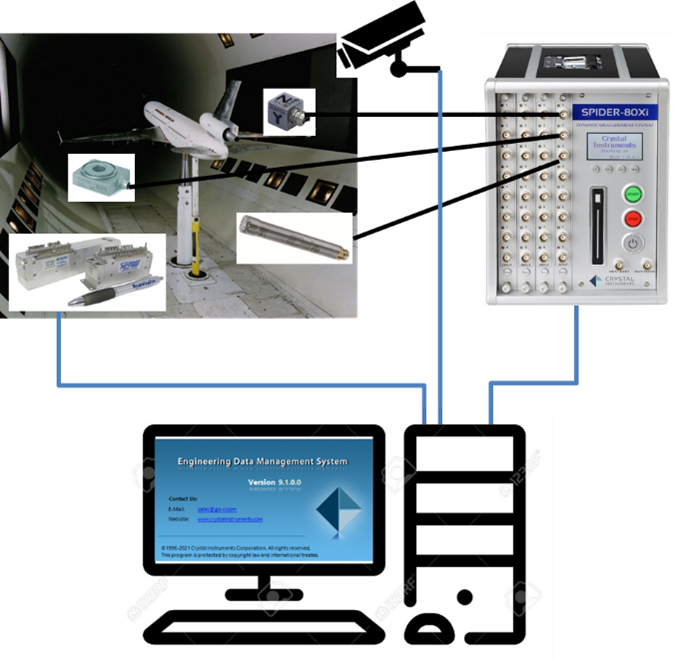 |
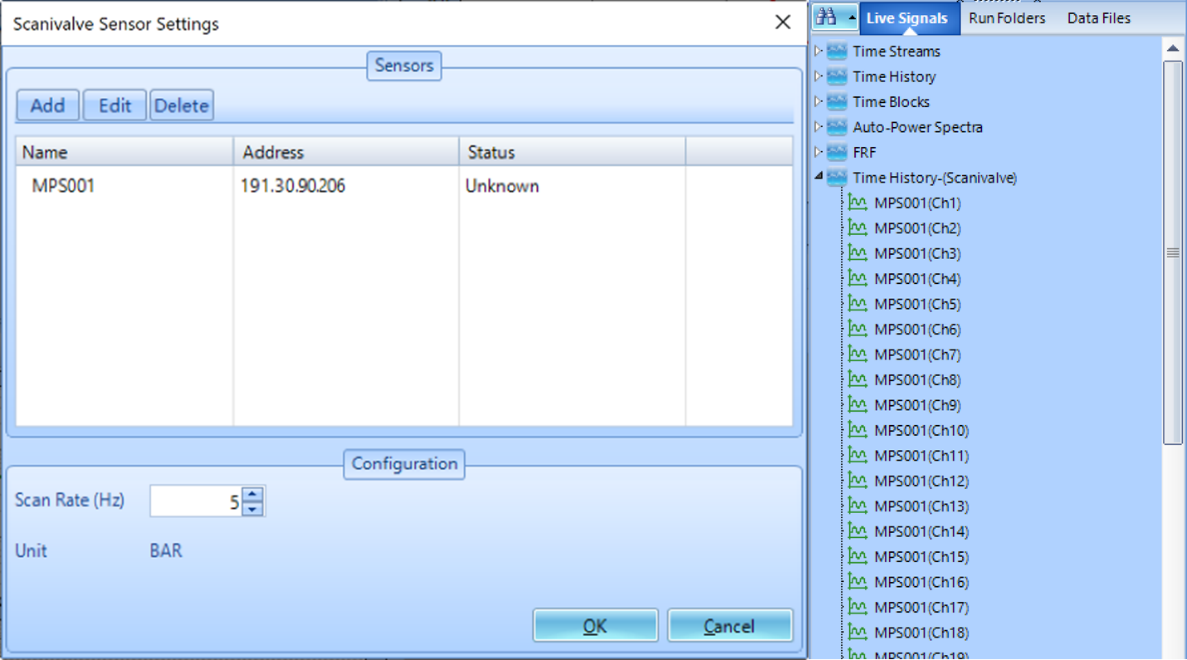 |
| Scanivalve Sensors can be combined with other sensors and EDM software for a comprehensive testing setup. | EDM software integrates seamlessly with Scanivalve sensors and presents data in an accessible way. |
Spider Capability:
The Spider product line can simultaneously measure 19 different measurement quantities:
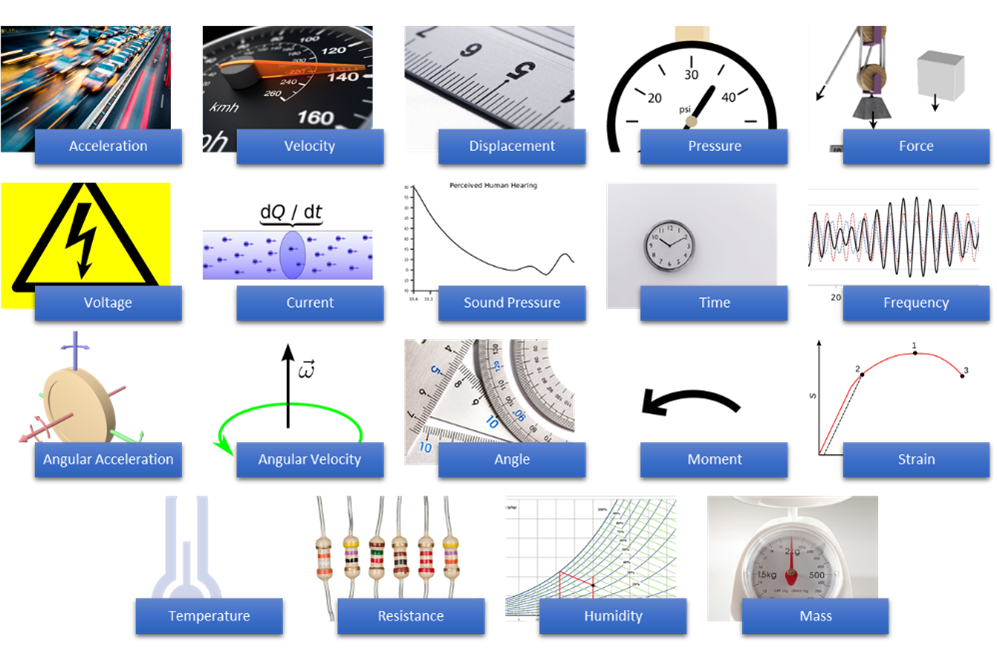
| Spider Measurement Quantities | |||
|---|---|---|---|
| Acceleration | Moment | Mass | Voltage |
| Frequency | Strain | Velocity | Current |
| Angular Acceleration | Temperature | Displacement | Sound Pressure |
| Angular Velocity | Resistance | Pressure | Time |
| Angle | Humidity | Force | |
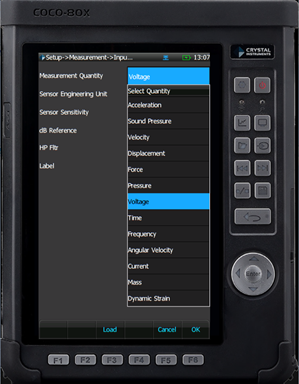
| CoCo Capability: The CoCo product line allows users to acquire 13 different measurement quantities, while a touchscreen (select models) provides easy test configuration. | |
|---|---|
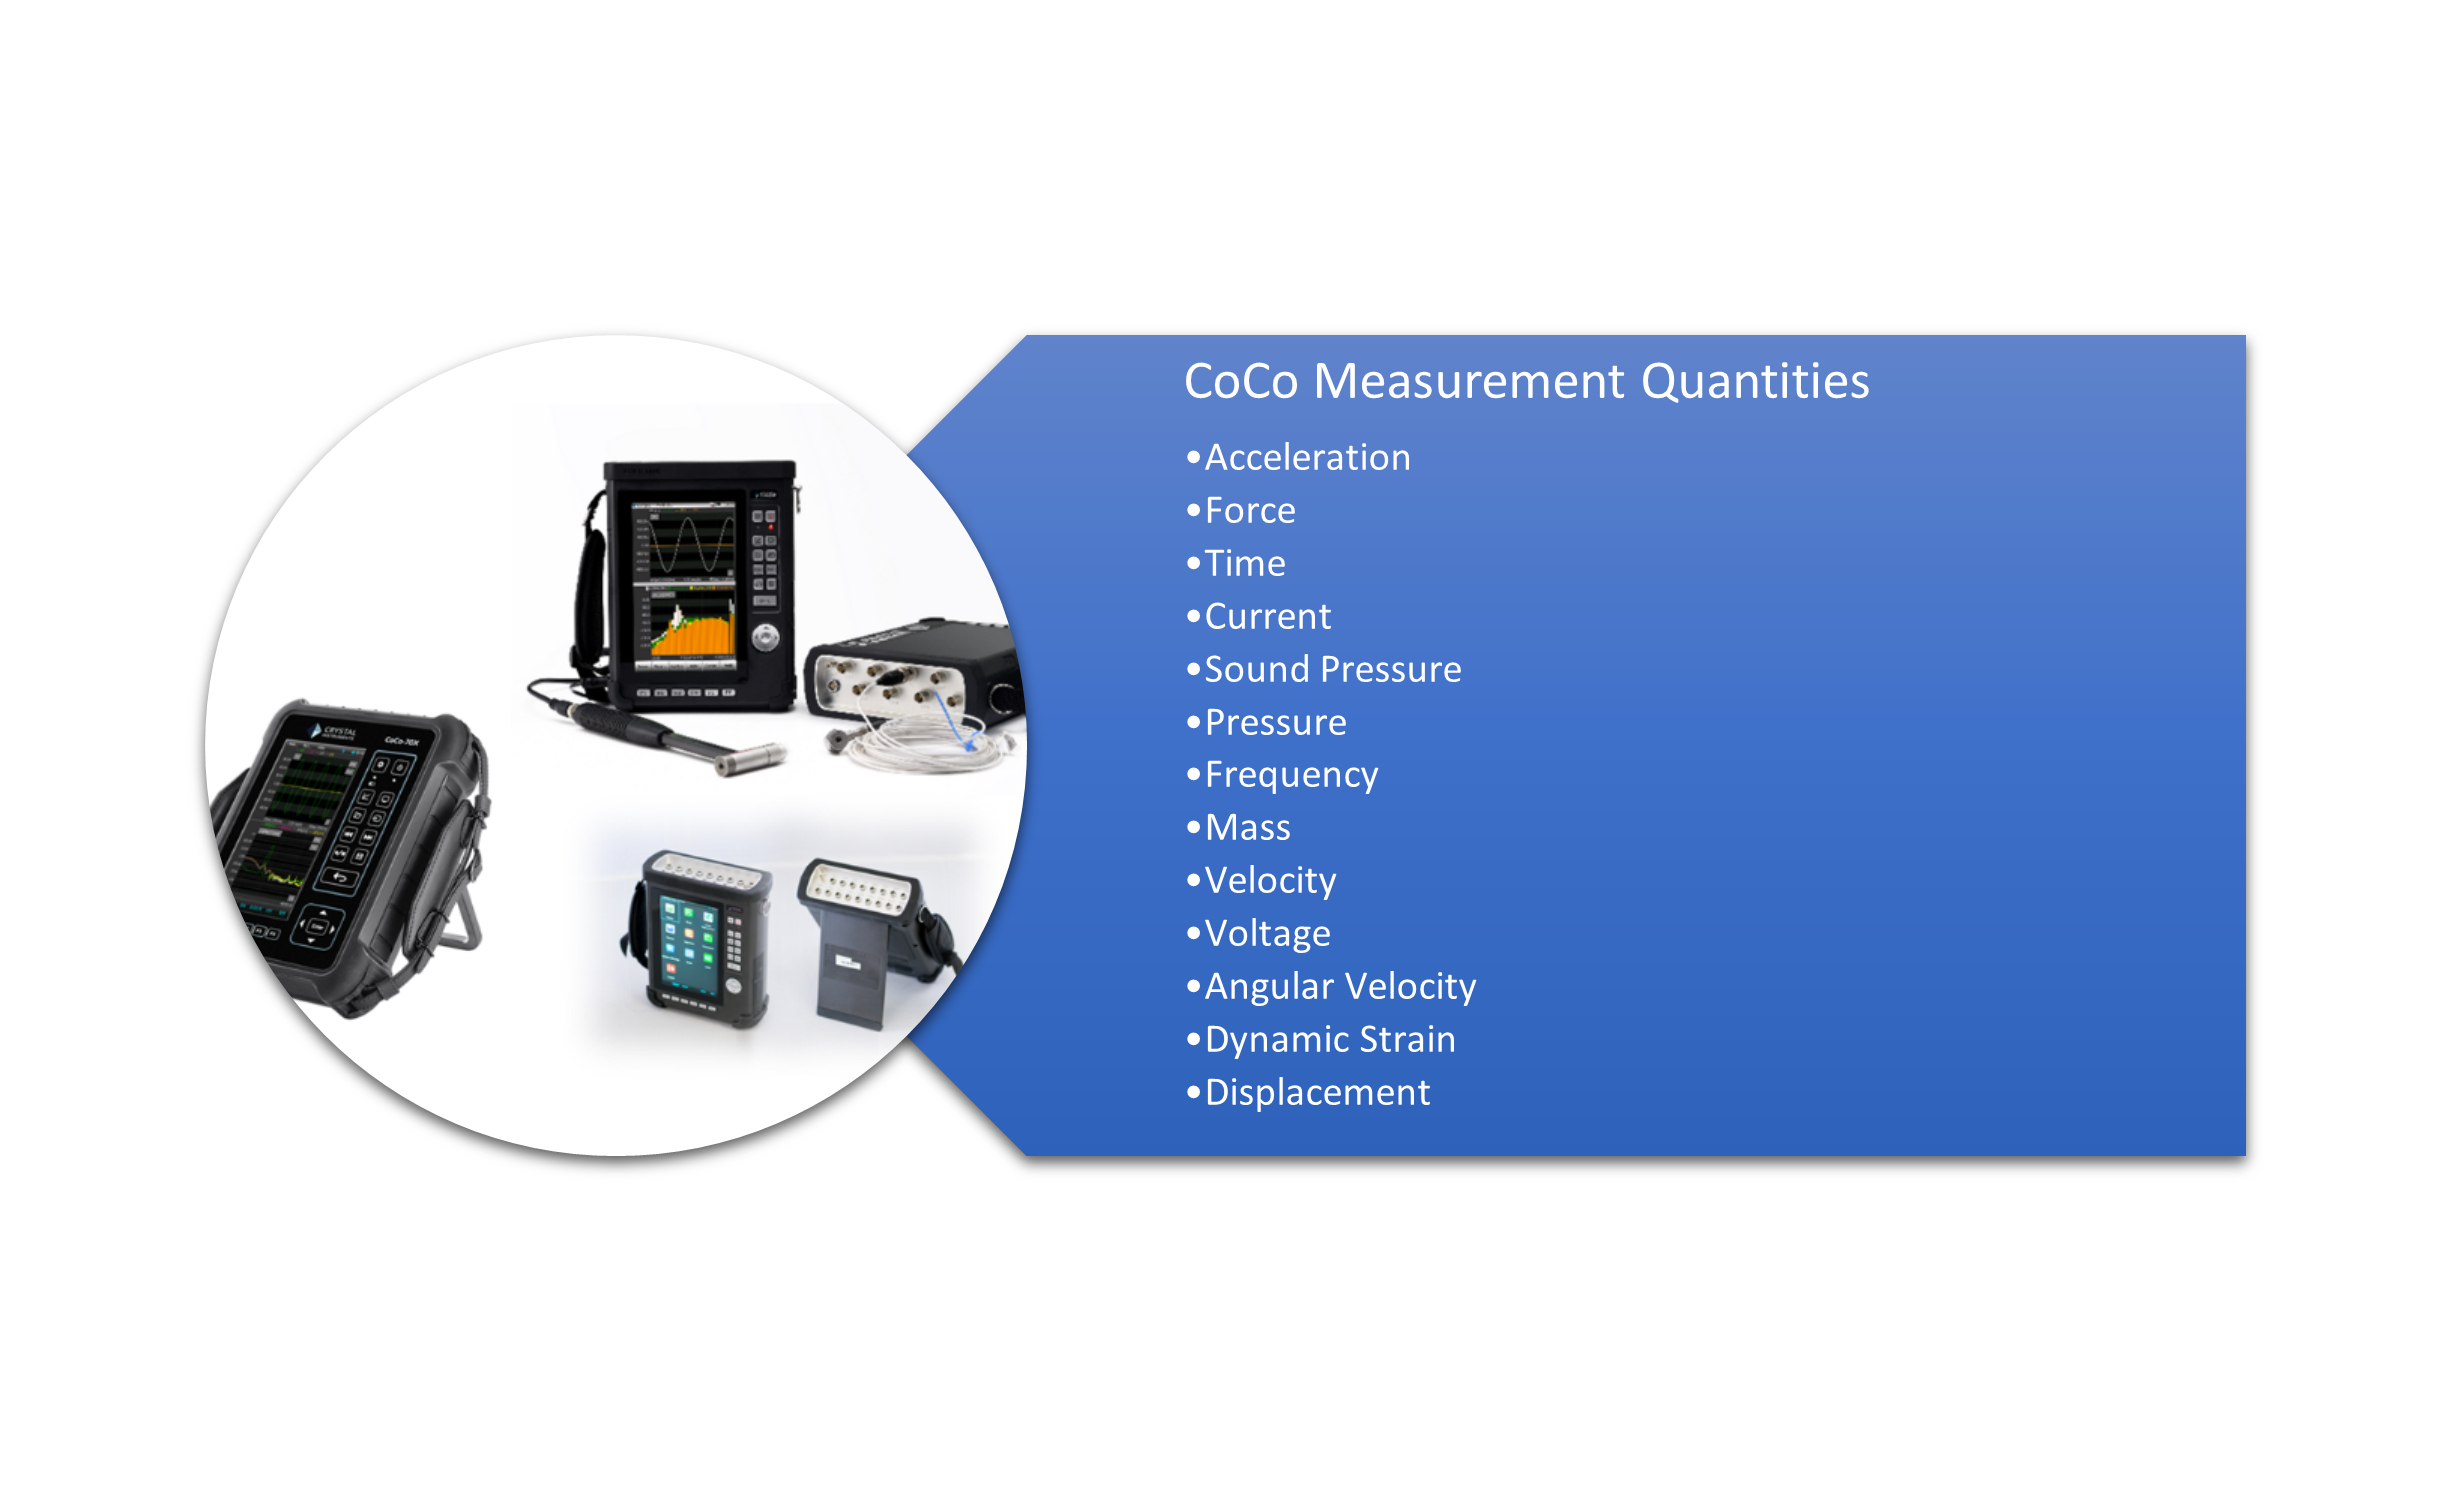 |
 |
Spider Input Modes:
The Spider product line is compatible with the following input modes:
Different Spider modules are more specialized for certain input modes.
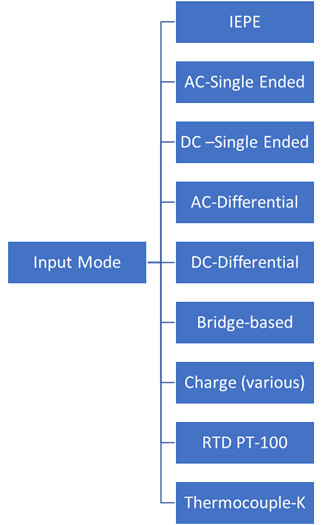
CoCo Input Modes:
The Coco product line supports 5 input modes:
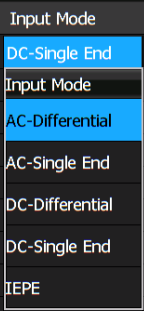
Input types can be easily selected within the CoCo software.
Data Types:
Both the CoCo and Spider product lines can measure many different data types. Time data, frequency data, and other data types are easily measured and saved.
Time Data:
The following standard time data and various operations can be saved:
Raw recorded time streams
|
Time blocks | TACHO: Tachometer data | Time Histories:
|
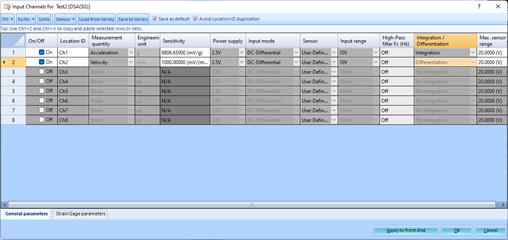
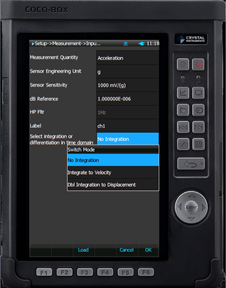 Integration is specified during input channel setup for the Spider and CoCo.
Frequency Signals:
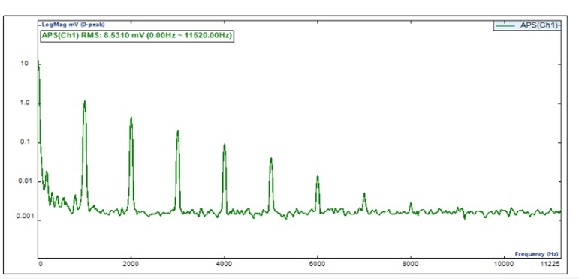
Frequency signals can be simultaneously captured and saved with the time data, including:
 |
 |
|---|---|
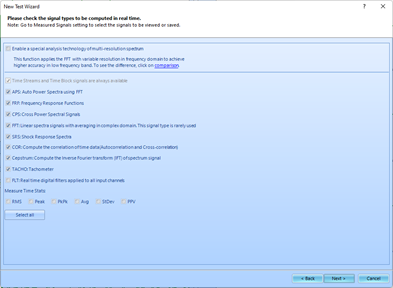
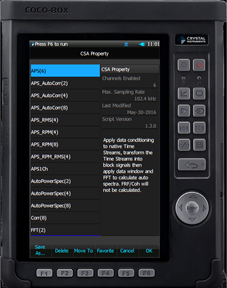
| Calculated signals can be selected when you initialize your Spider test. | CoCo devices allow you to record time streams and calculate signals via various CSAs. |
| APS: Auto Power Spectra using FFT | FRF: Frequency Response Functions PC FRF [Spider]: Wide variety of measured signals can be configured for Spider systems. 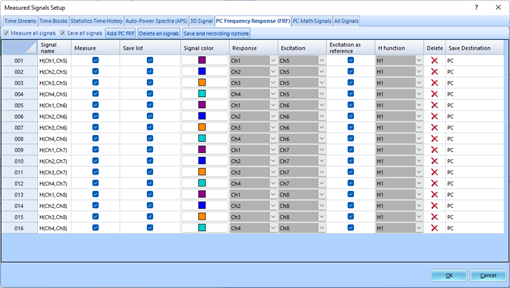 |
CPS: Cross Power Spectral Signals |
|---|---|---|
| FFT: Linear spectra signals with averaging in the complex domain | SRS: Shock Response Spectra | COR: Computed correlation of the time data, both autocorrelation and cross-correlation |
| Cepstrum: The Inverse Fourier Transform (IFT) of a spectrum signal | Tacho: Tachometer | PC Math Signals [Spider]: Add/Subtract/Multiply/Divide 2 signals |
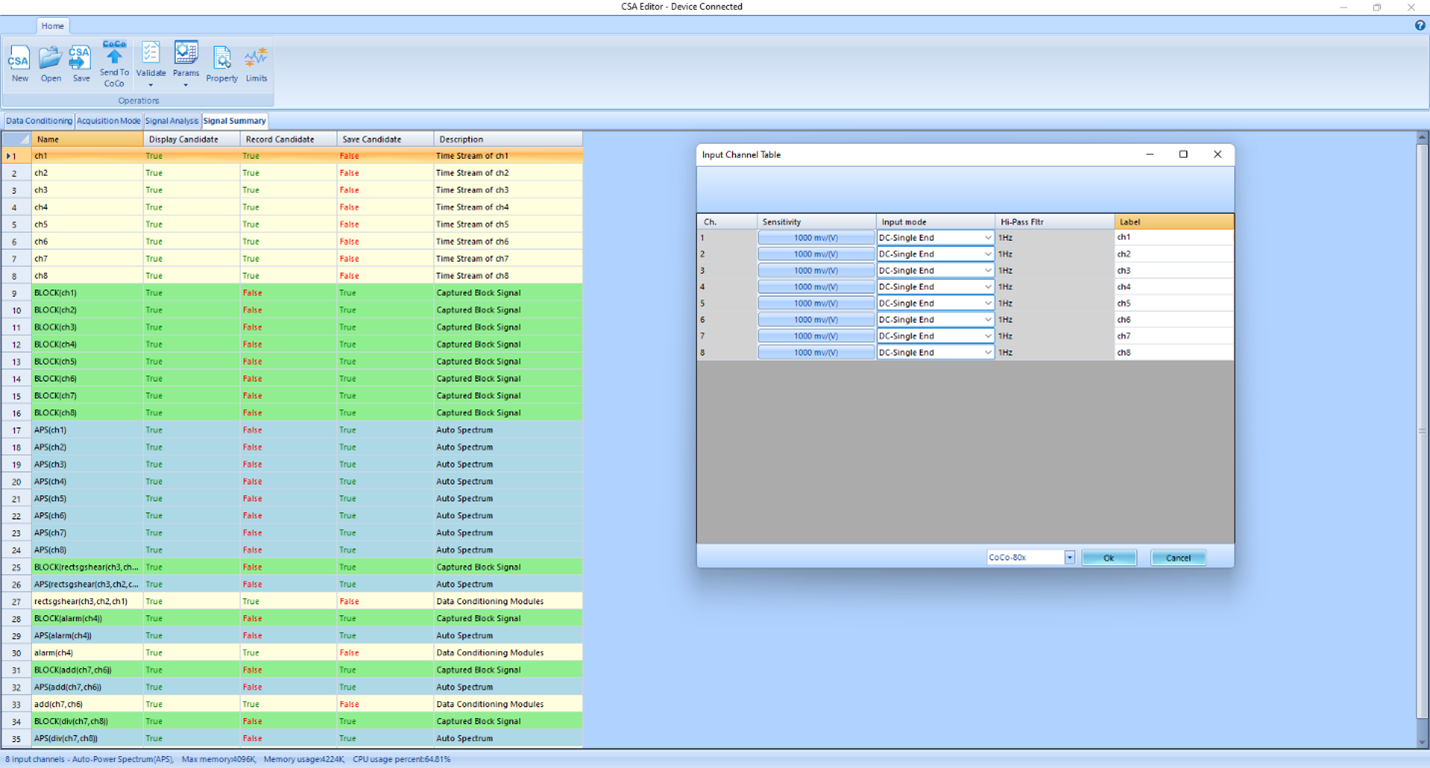
Math Signals [CoCo]: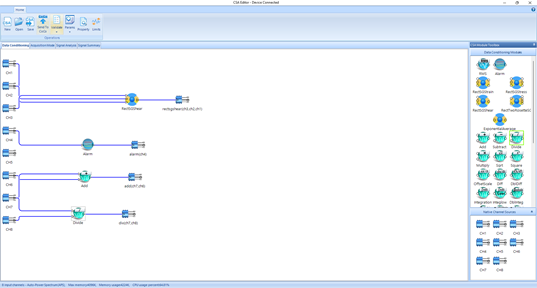 Math operations for input channels can be preconfigured for CoCo devices using an interactive layout. |
Data conditioning, including digital filters, is available for both the CoCo and Spider product lines. | Spider systems can perform math operations on incoming signals. 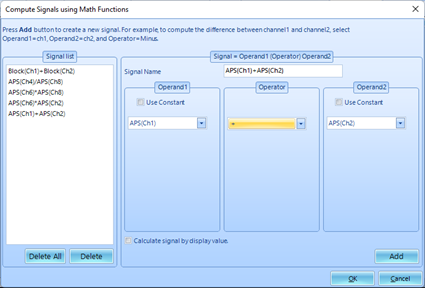 |
Other types of data:
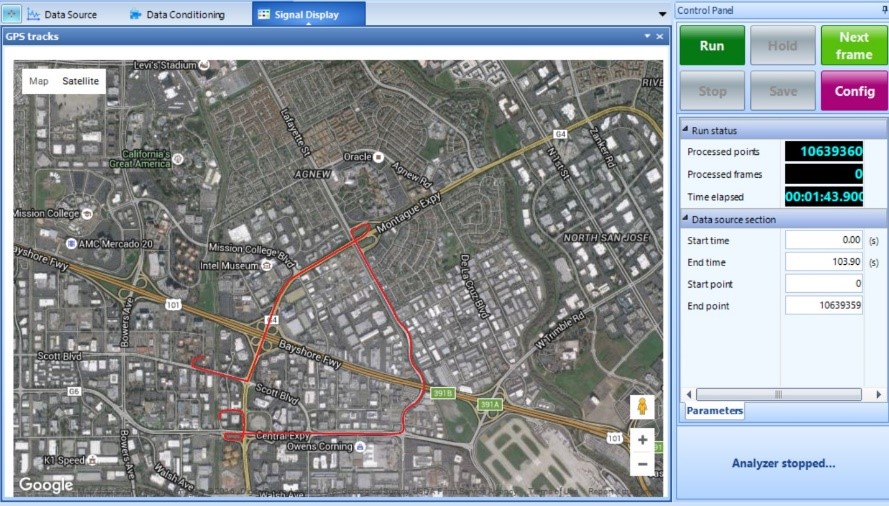
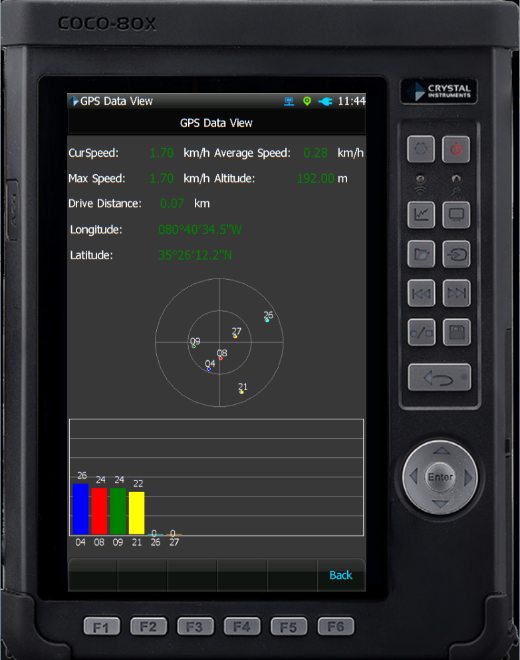
| CAN bus: Both the Spider and CoCo product lines can send and receive CAN Bus messages and data. | GPS Data [CoCo]: Via a GPS antenna, the CoCo can synchronize GPS data with other acquired data. The data can then be viewed in post-processing. | 3D Signals [Spider]: Acquire signals of measurement quantity, frequency, and time. |
|---|---|---|
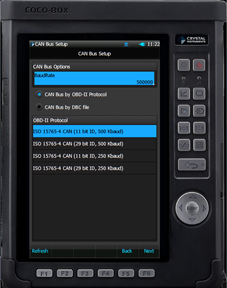 CAN bus on CoCo 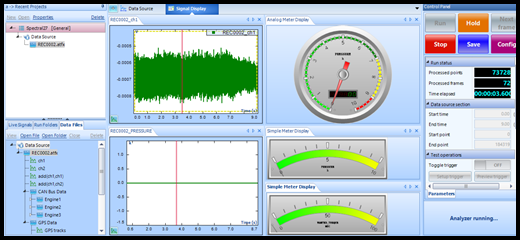 Spider units can integrate with CAN data in a variety of ways. |
  |
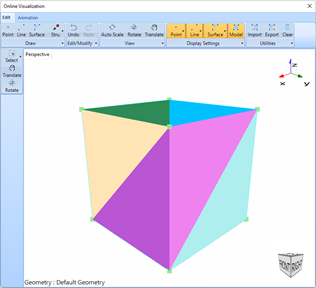
Spider units can easily measure user-configured 3D signals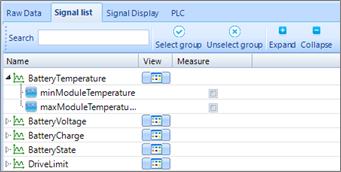 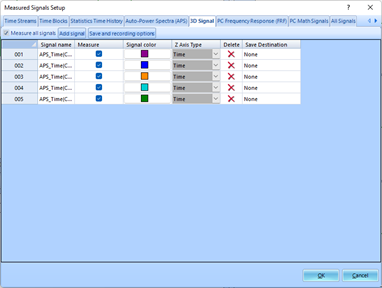 |
For more information about the CoCo and GPS, watch this video:
3. What interface will I be using?
The Crystal Instruments Spider and CoCo units use intuitive, straightforward interfaces to simplify the data acquisition process.
Spider modules are configured with EDM Dynamic Signal Analyzer (DSA) software. This product line can run without a live PC connection and also interfaces with more basic Time Data Acquisition software.
CoCo units can be configured with CoCo DSA software. CoCo units also feature an interactive software interface and screen.
Both products allow users to combine many different display windows into a single, personal view of the data.
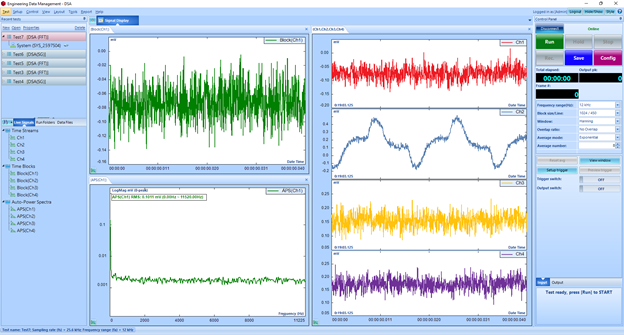
The Spider uses a highly customizable dashboard display that is accessed via Engineering Data Management (EDM) PC software: |
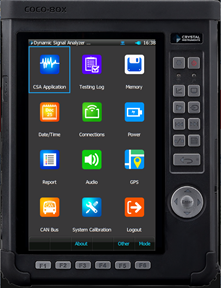
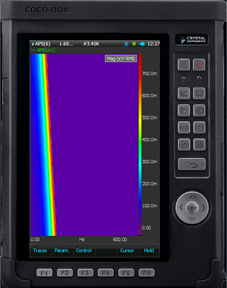
The CoCo connects to a PC via the EDM software suite and the unit user interface provides the familiar feel of a personal mobile device: |
|---|---|
 |
  |
The Spider Dynamic Signal Analyzer (DSA) UI has an interface similar to familiar software applications. |
Users can preconfigure the CoCo by using the EDM software. The CoCo-80X and CoCo-90X platforms deliver a combination of touchscreen utility, simple hard-keys, and smooth UI for an enjoyable data acquisition experience. |
Let’s take a look at some default displays you can use on the Spider and CoCo.
Channel Status [Spider]: |
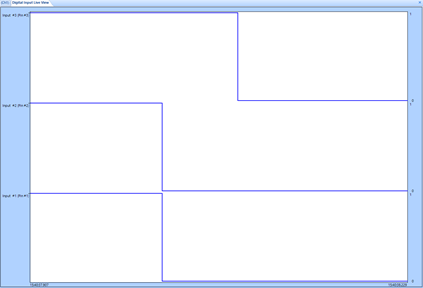
Digital I/O [Spider]: |
Run Log [Spider]: |
|---|---|---|
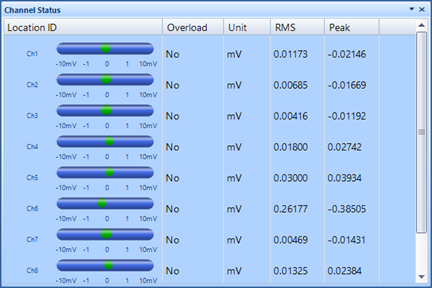
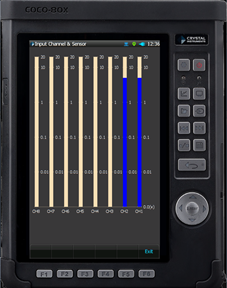
Channel Status [CoCo]: |
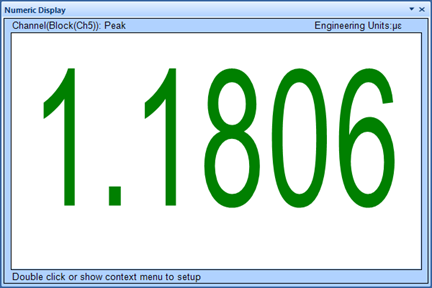
Numeric Display [Spider]: |
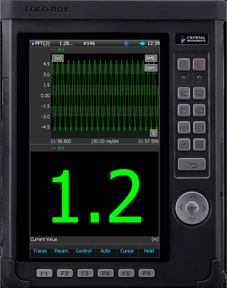
Numeric Display [CoCo]: |
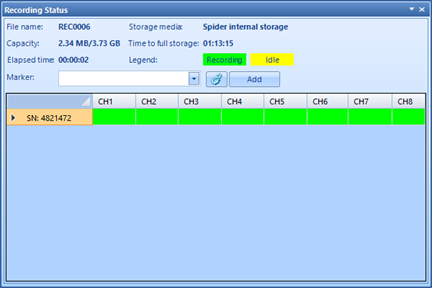
Recording Status [Spider]: |
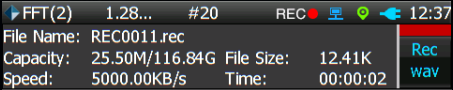
Recording Status [CoCo]: |
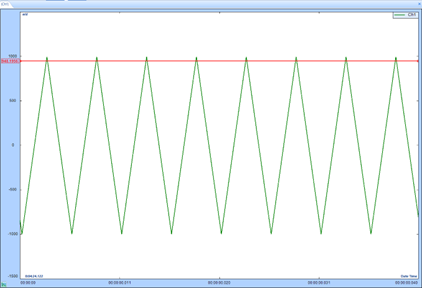
Limit Status [Spider]: |
Orbit [Spider]: |
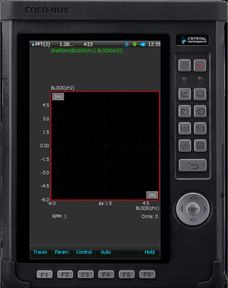
Orbit [CoCo]: |
Cross-plot [Spider]: |
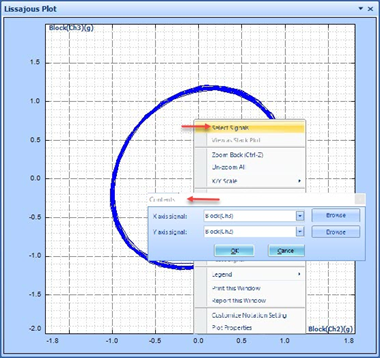
Lissajous plot [Spider]: |
Cross-plot [Spider]: |
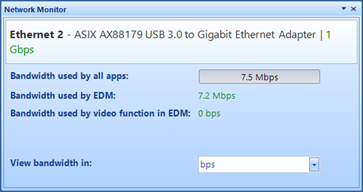
Network Monitor [Spider]: |
Bode Plot [Spider]: |
Bode Plot [CoCo]: |
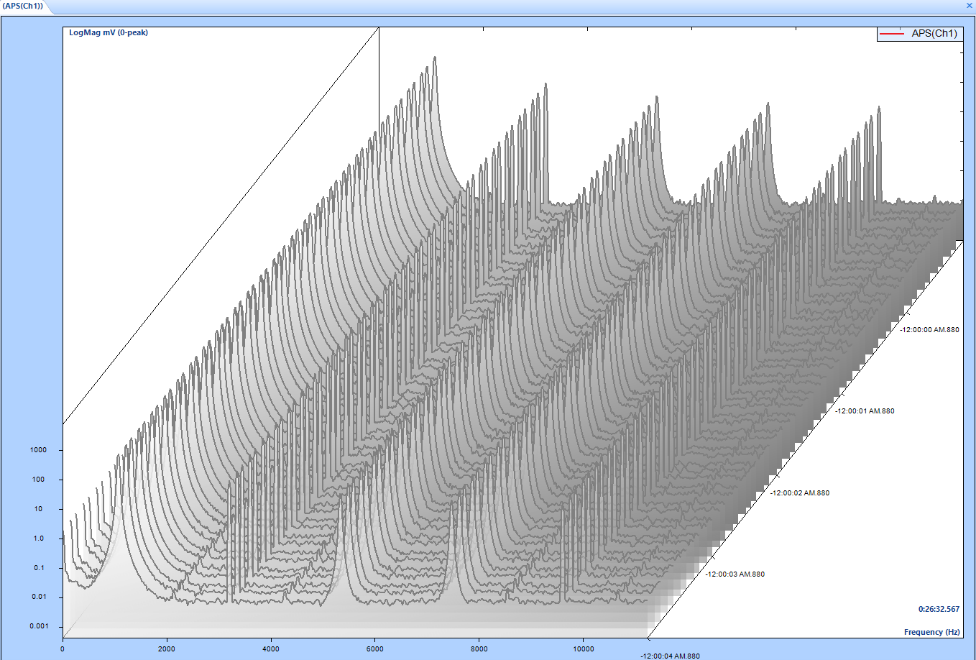
Waterfall Window [Spider]: |
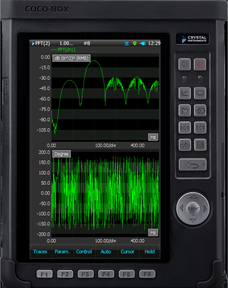
Waterfall Window [CoCo]: |
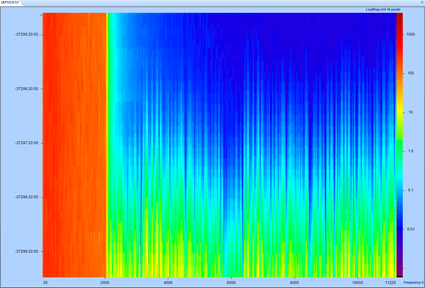
Colormap Window [Spider]: |
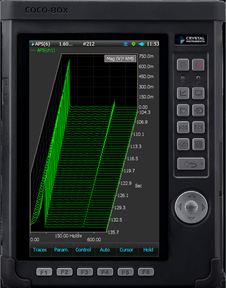
Colormap Window [CoCo]: |

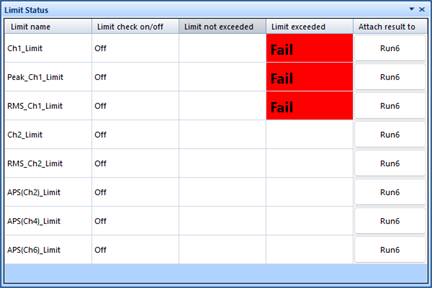 The Spider software shows users the real-time status of limits placed on input channel data.
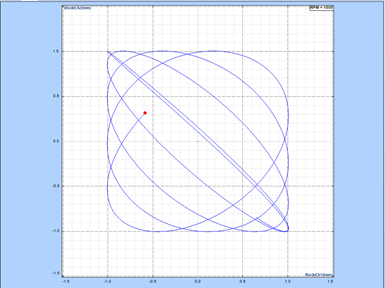


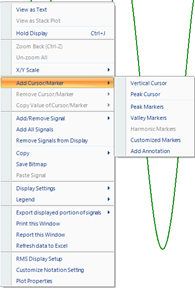
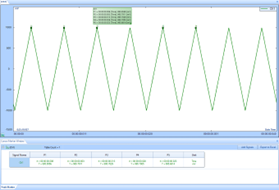
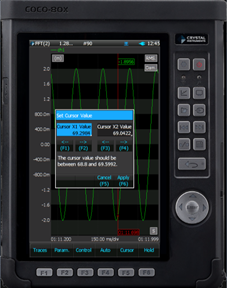
Both Spider DSA and the CoCo allow users to take a closer look at live or saved data with cursors. Setting up those cursors, using the various cursor types, and dragging them around streamlines the live data analysis process.
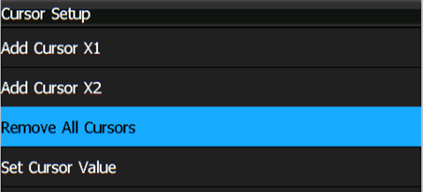
| Vertical Cursors [Spider]: | Vertical Cursors [CoCo]: |
|---|---|
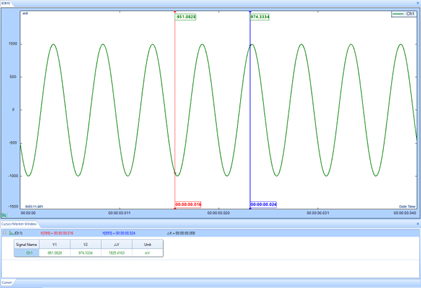 |
 |
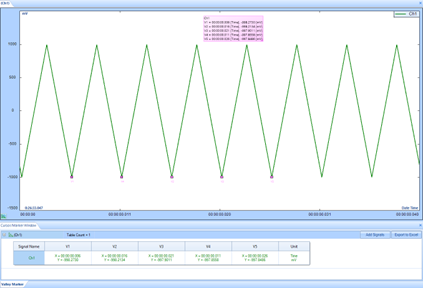
| Peak Cursors [Spider]: | Peak Markers [Spider]: |
 View the peak value of your data in Spider DSA. |
 Mark all the significant peaks in the data that your Spider collects. |
| Valley Markers [Spider]: | Harmonic Markers [Spider]: |
 Interested in the low points? Spider DSA can do this automatically. |
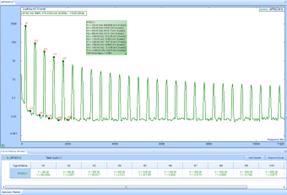 Spider DSA displays the harmonics of data in a live display to save users from post-processing. |
| Customized Markers [Spider]: | Customized Markers [CoCo]: |
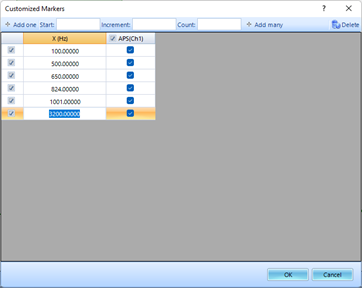 Create custom markers to examine data while it is being acquired. |
 CoCo Custom Marker setup |
4. How will recording take place?
The combination of Crystal Instruments software and hardware can perform a variety of tasks during data recording. To answer “How should recording take place?” three more questions arise:
What can initialize recording?
What can be done during recording?
What can be done after recording?
Before we dive into those questions, let’s take a brief detour and have a short overview of how data is acquired by the Spider and CoCo hardware.
Both the Spider and CoCo hardware utilize dual analog-to-digital converters (ADCs) in order to capture data at both low and high frequencies, without saturation in the lower frequency range. High amplitude resonant signals are filtered out before the analog signal is amplified, passed through an anti-aliasing filer, converted to digital data, and output to the digital signal processor (DSP) or the EDM software on the PC.
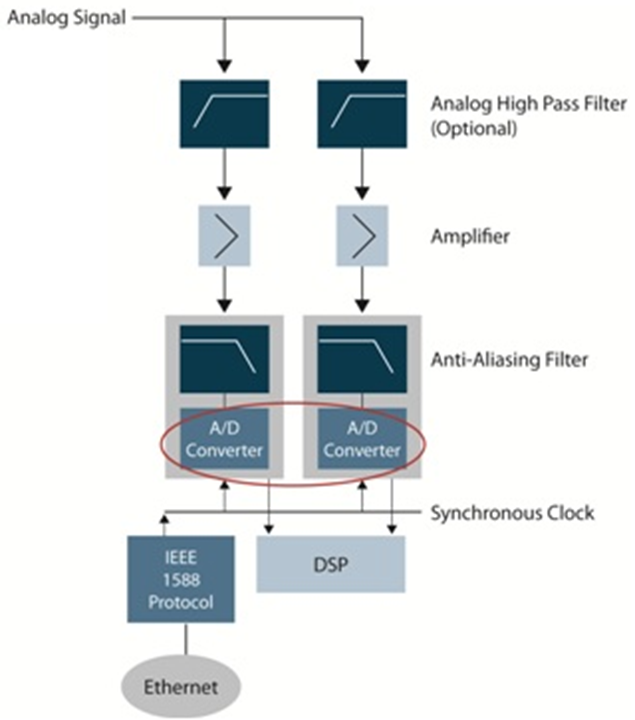
Basic data acquisition block diagram for Crystal Instruments hardware.
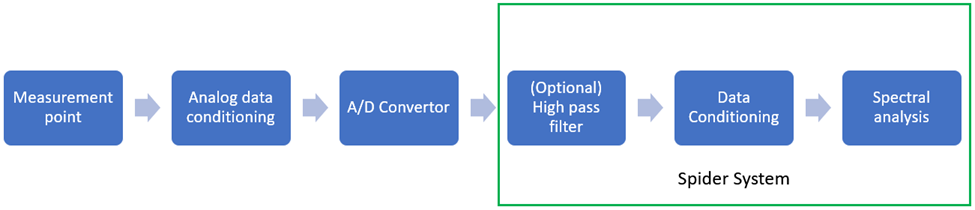
Spider data acquisition workflow
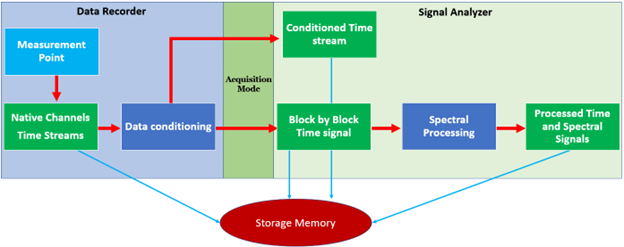
Crystal Instruments signal saving workflow
Triggers:
Both the Spider and CoCo hardware allow you to configure triggers to initialize data recording.
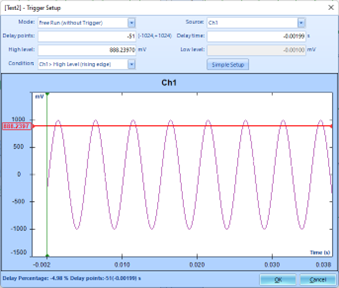 Spider trigger setup |
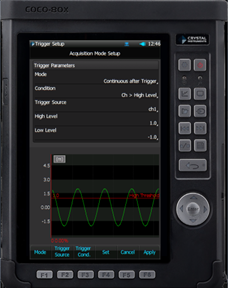 CoCo trigger configuration |
|---|
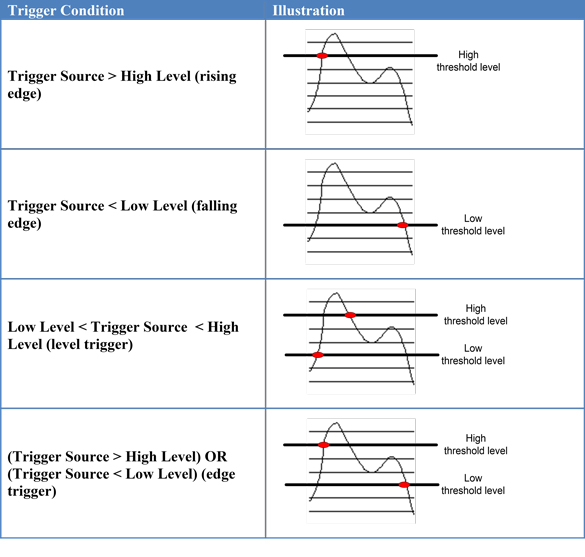
Trigger Modes:
| Free Run | Displays block data acquired from the time stream as fast as possible or at the overlap rate set by the user. Free Run is commonly used to analyze random or irregular signals. |
|---|---|
| Continuous after Trigger | Waits until a trigger event is detected. After the first trigger event, averaging begins from zero and the system runs in Free Run mode. |
| Single-Shot By User | Acquires one block every time the user presses the Run button. This mode is best for observing a time signal block by block at arbitrary times. |
| Auto-Arm Trigger | Acquires one block of data every time a trigger event is detected. This block is added to the current average based on the average mode settings under Analysis Parameters. If another trigger event is detected, a new block of data will be acquired. This process will continue indefinitely with no user interaction. |
| Manual-Arm Trigger | Works like Auto-Arm trigger but prompts the user to accept or reject each captured block. Only accepted blocks are added to the average. This mode is best for applications such as impact hammer testing where the user may not have confidence in the signal quality of some of the data blocks. |
Trigger Conditions:
Alarm Limits [Spider]:
Alarm limits on inputs can be used to start data recording with the Spider hardware.
- Vibrations with alarm limits
- Time blocks
- Long recording signals
- RMS or peak levels
- Harmonics level
- Power spectra
- FRF (Frequency response function)
- Phase measurement
- Various sound levels with alarm limits
- Temperature, humidity, voltage, strain gage
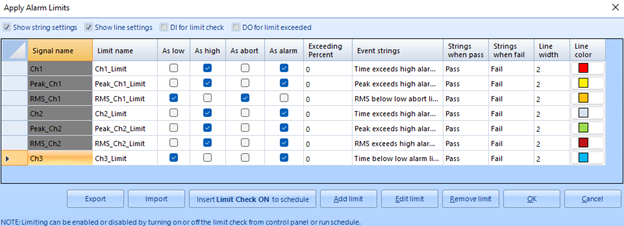 Spider alarm limit window |
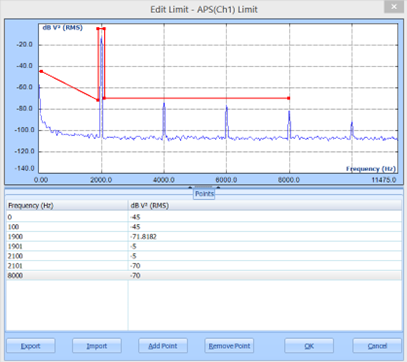 Frequency signal alarm limit setup |
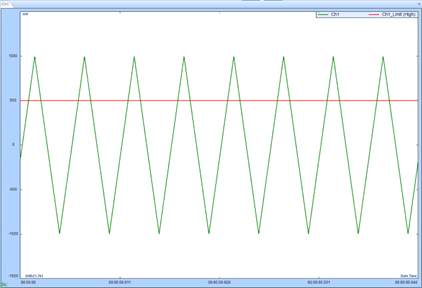 Spider alarm limit display |
Digital Input/Output (DIO) [Spider]:
DIO inputs to a Spider module can commence data recording as well.
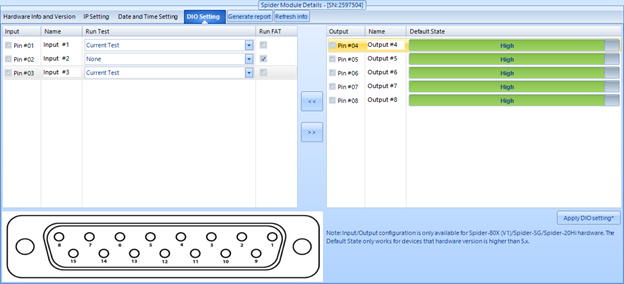
Spider DIO setup
Socket messages [Spider]:
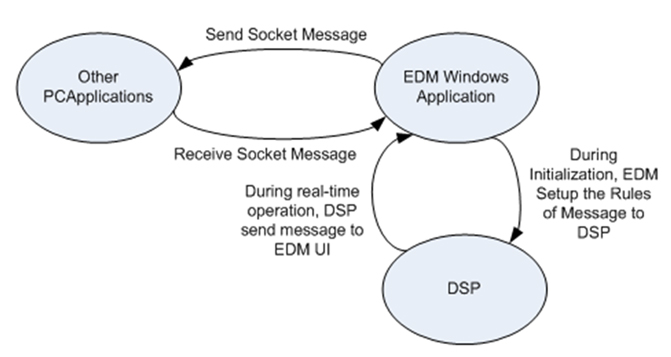
Spider socket message communication process
Learn more about Crystal Instruments’ socket message capabilities
API [Spider]:
The Spider hardware can also communicate with other non-Crystal Instruments devices using the Spider API. The supported languages are C++ and C#.
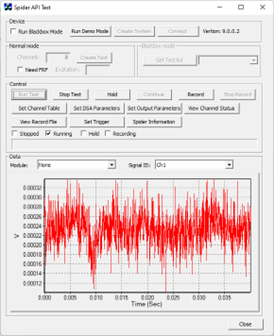
Spider API Interface
Learn more about how to integrate API and EDM.
CAN bus [Spider]:
A CAN bus message to the Spider can start data recording.
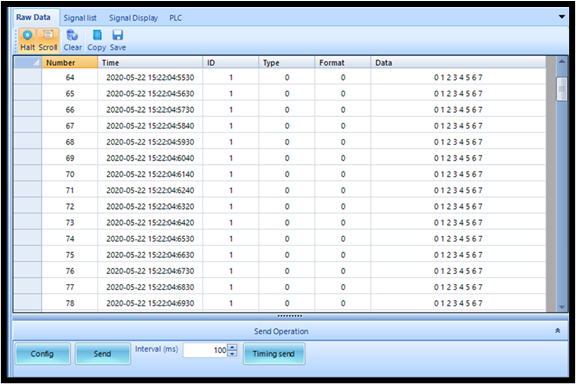
Spider CAN bus message window
Recording can be manually started with either a software button (Spider) or a physical hard key (CoCo).
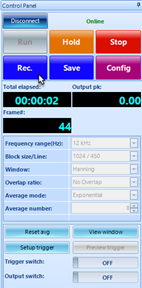
Spider Recording button
CoCo Recording hard-key
Automatically start recording:
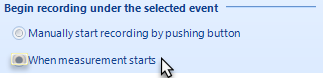
In Spider DSA, automatically recording for the rest of your data runs is set by clicking only one setting.
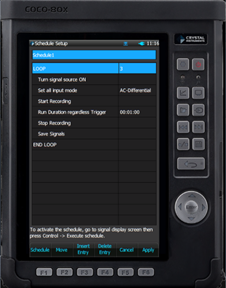
For the CoCo, recording can be automated using the schedule feature.
Capture video [Spider]:
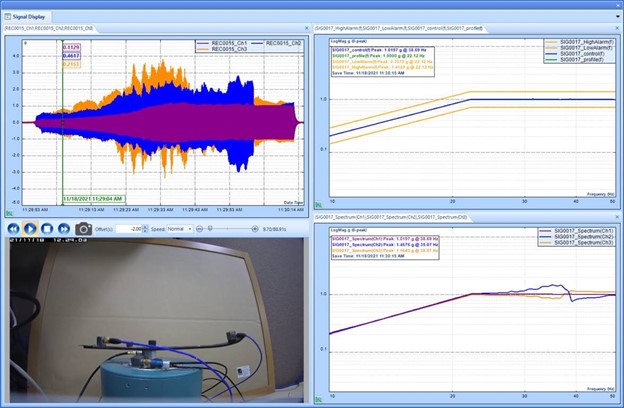
Capture synchronized video with other data in Spider DSA.
Major video capture function features:
- Photo capture
- Scheduled recording
- Playback
To learn more about Video Capture, visit: www.crystalinstruments.com/blog/2021/11/18/video-capture-for-test-monitoring
Scan barcodes [Spider]:
For quality control or production environment applications, Spider DSA implements a barcode scanner feature for your convenience.
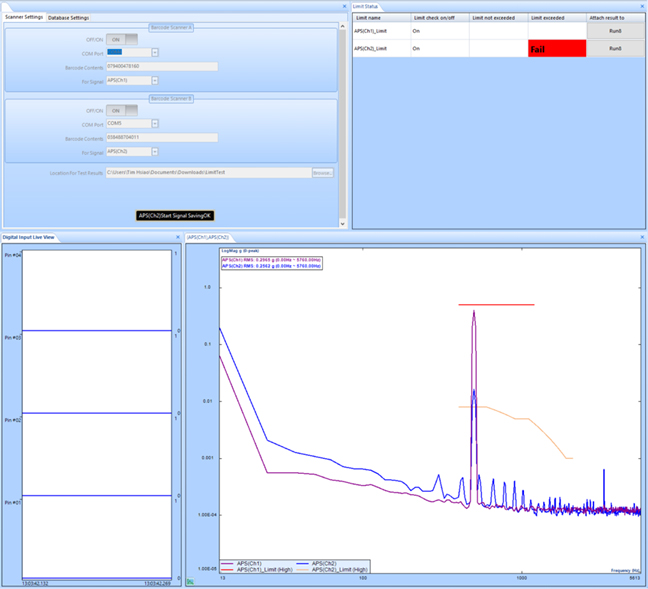
Spider DSA barcode scanner interface
Send messages:
During data recording, both product lines can send out messages using a variety of methods.
Via DIO [Spider]:
If an input channel is triggered or an alarm limit exceeded, the Spider can send a DIO pulse to external hardware.
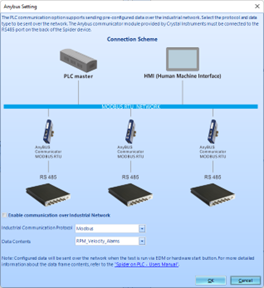
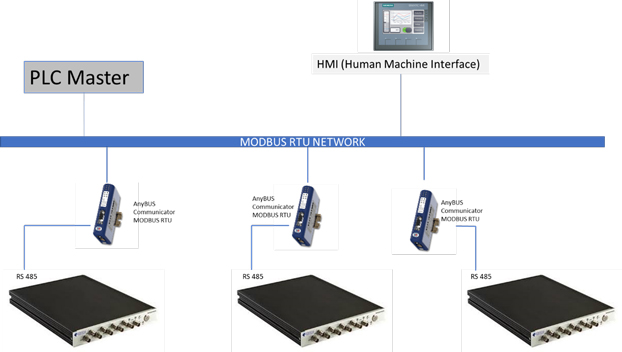
Via Anybus [Spider]:
The Spider system can communicate via Anybus and integrate with PLC systems.
|
|
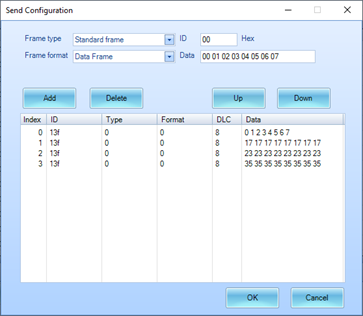
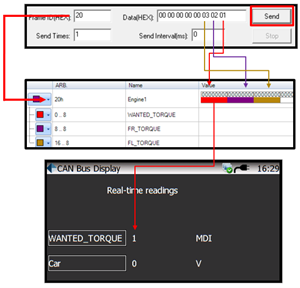
Via CAN Bus:
Both product lines can send out CAN Bus messages to other hardware during data acquisition.
|
|
Via Profibus [Spider]:
Refer to the section on Anybus.
Integrate with LabVIEW [Spider]::
The Spider unit can also integrate with LabVIEW.
Spider LabVIEW integration
Ditch the PC and use Black Box Mode [Spider]:
If you are unable use a CoCo unit to take data or connect a Spider unit to the PC – you can run your Spider module in Black Box Mode and acquire data without a live PC connection. The Spider module then will be controlled using the external buttons.
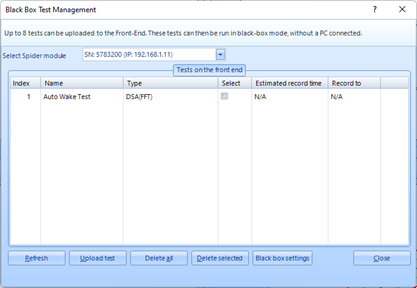
Black Box Test Management window in Spider DSA
For more information on Black Box Mode, visit www.crystalinstruments.com/spider20-remote-timer-onoff-with-black-box-mode or watch the following video:
Save battery with Spider Auto-wake [Spider]:
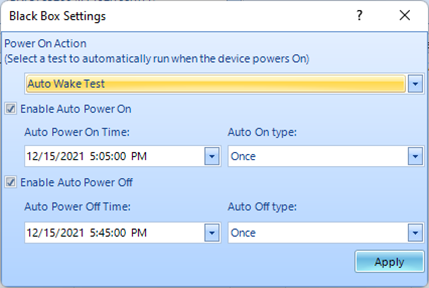
Spider Auto-Wake setup
To learn more about this feature, visit www.crystalinstruments.com/blog/2022/2/23/auto-wake-function-for-data-acquisition-daq-machine-condition-monitoring-and-vibration-analysis
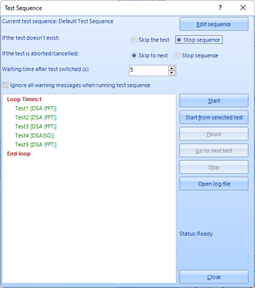
Automate with EDM Testing Sequence:
Run multiple tests back-to-back with an automated testing sequence on your Spider and CoCo device. Set up the test and click “Run”!
|
|
Use circular recording to streamline acquisition [Spider]:
Crystal Instruments provides you with the ability to simplify data recording and reduce file sizes by only capturing the desired event. Trivial data does not get saved.
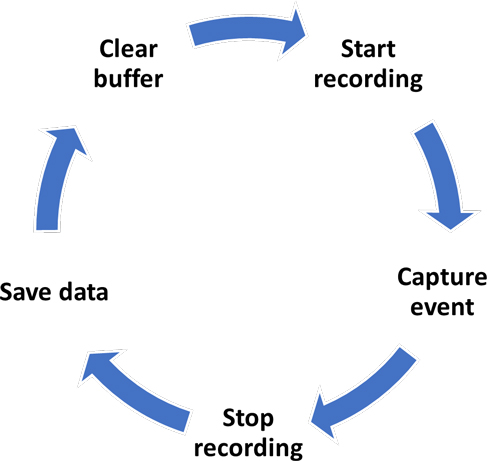
Basic circular recording cycle
To learn more about circular recording, visit the following page: www.crystalinstruments.com/blog/2022/2/23/advantages-of-circular-recording-vs-standard-timestream-recording
Alarm Limits [Spider]
Alarm and abort limits can also be used for monitoring data with the Spider hardware.
CAN Bus Alarms [Spider]:
The Spider hardware gives you the powerful option to set alarm limits on incoming CAN Bus data from other devices.
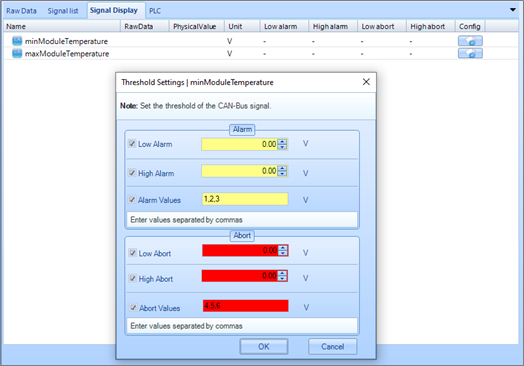
Spider CAN Bus alarm setup
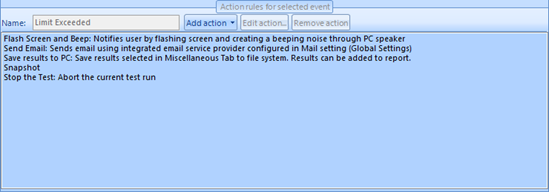
Event Action Rules [Spider]:
The Spider DSA software provides you with the cutting-edge function of executing various measures during data acquisition with the Event Action Rules feature. For instance, if a high limit is triggered on an input channel, the current test can be immediately stopped and a report of the event could be generated too.
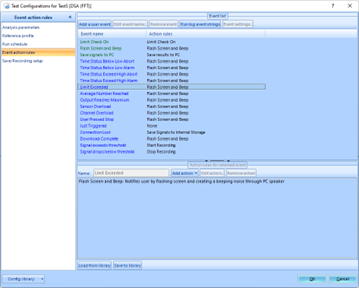
Event Action Rules window in Spider DSA
Event Action Rules features include 15 default event names, which can be combined with 18 unique event action rules, including:
- Warn the user onscreen
- Create a report
- Take a screenshot
- Send a socket message
- Send an email
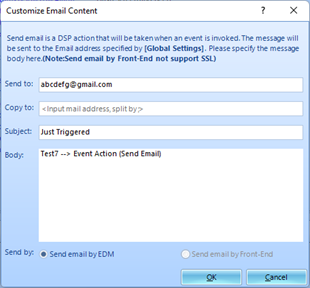
Spider DSA setup to send an email based on an Event Action Rule - Send a DIO pulse
- Clear the internal memory
- Save data
- Turn on a signal
- Record video
Event Action Rules Sequence:
Event action rules can also be combined in a sequence for a single action:
Sequence for Event Action Rules
Customize messages for Event Action Rules:
Users can configure customized messages for any Event Action Rule.
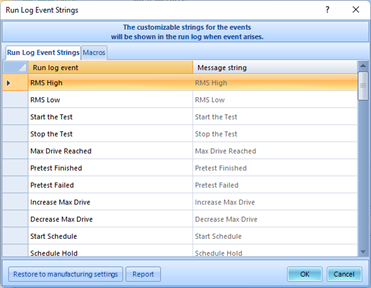
Run Log Event Strings for Event Action Rules
To learn more about Event Action Rules, visit www.crystalinstruments.com/remote-condition-monitoring-software
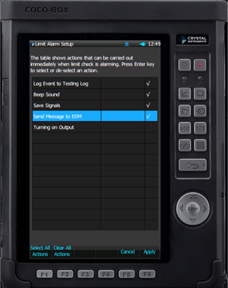
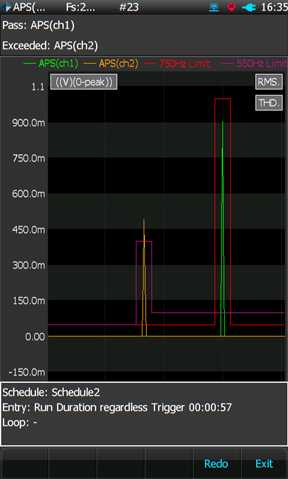
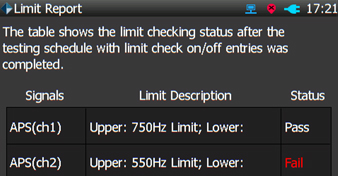
Alarm Limits [CoCo]:
CoCo hardware allows users to set up alarm limit tests, monitor a system, and receive a report if any alarm conditions were violated.
|
|
|
After recording, there are many possibilities to take advantage of with Crystal Instruments hardware and software. Let’s explore a few.
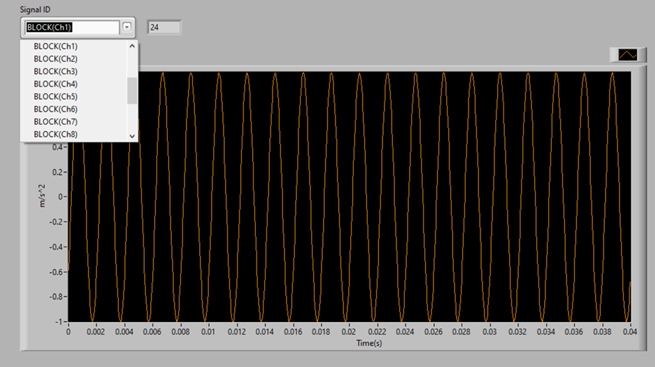
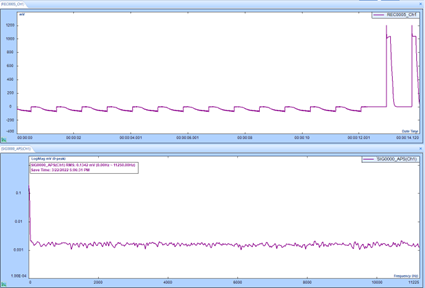
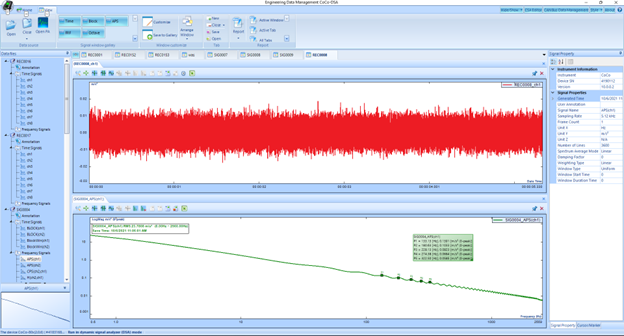
View recorded time streams and saved signals:
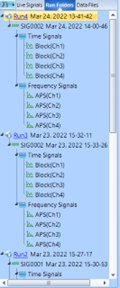
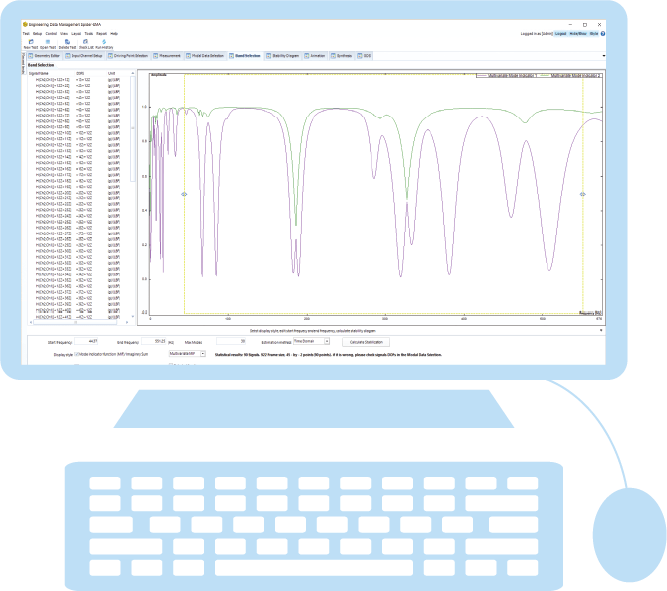
In Spider DSA, CoCo DSA, and on the CoCo hardware, the saved data can be viewed an manipulated just like the live data.
 Spider DSA saved data view |
 CoCo DSA saved data view |
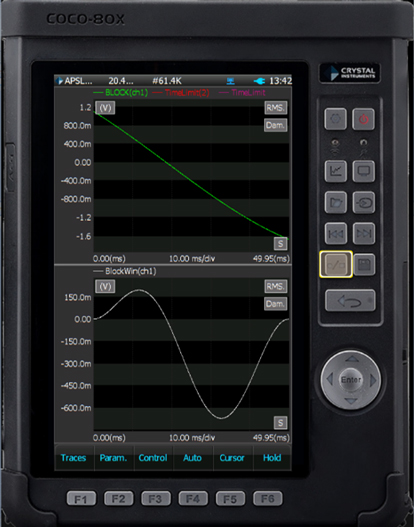
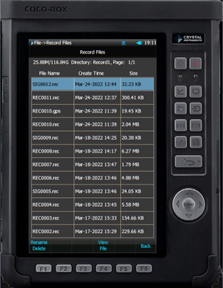
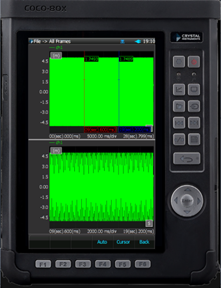 CoCo saved data view |
Save files:
For both hardware platforms, the collected data can be saved in the various file formats listed in the following table:
| File Extensions | Format | Descriptions |
|---|---|---|
| .emf | Microsoft | Composite Signal Window graph |
| .log | Crystal Instruments | Run log |
| .run | Crystal Instruments | Run identifier |
| .atfx | ASAM Transport Format | ASAM Transport Format XML |
| .dat | data file used for atfx files | |
| .stk | Crystal Instruments | EDM Vibration Test Control file |
| .lic | Crystal Instruments | License Key |
| .ssk | Crystal Instruments | Spider System File – Spider System Device Configuration |
| .docx | Crystal Instruments | Word Document – Test report |
|
|
Export files:
Data collected from a Spider module or CoCo unit can be exported in the following file formats:
| File Extensions | Format | Descriptions |
|---|---|---|
| .atfx | ODS ATF/XML | ASAM Transport Format XML |
| .txt | User Defined ASCII | Text file |
| .csv | User Defined CSV | Comma separated values |
| .uff | UFF ASCII | Structural Dynamics Research Corporation Universal File Format |
| .unv | UFF ASCII | Siemens Universal File Dataset |
| .buff | UFF Binary | Structural Dynamics Research Corporation Universal File Format |
| .bunv | UFF Binary | Siemens Universal File Dataset |
| .mat | MATLAB | MATLAB data |
| .hdr | TEAC TAFFmat | Teac Data Acquisition File Format |
| .wav | Wave File | IBM Microsoft Waveform Audio File Format |
| .tdms | NI-TDMS | National Instruments structured binary file format |
| .rsp | RPC Time File | RSLogix PLC |
| .dat | TEAC TAFFmat | Teac Data Acquisition File Format |
Save to network attached storage (NAS) [Spider]:
EDM software allows users to save data on a network attached storage device instead of the Spider internal memory. Crystal Instruments provides a dedicated NAS unit. To learn more, visit the following page: www.crystalinstruments.com/spider-nas-network-attached-storage
Simplify saving with Auto-Data Storage Management [Spider]:
For repetitive data collection, the Spider DSA software allows users to automate the saving of your data by helping you:
- Download data from Spider internal storage to PC
- Convert file type
- Download to PC, then clear internal storage
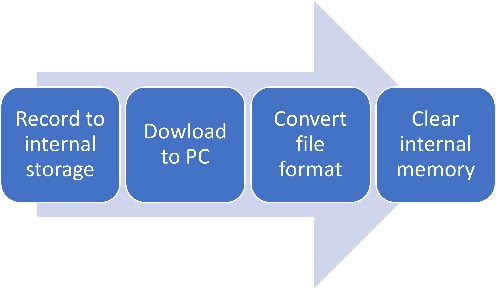
Spider Auto Data Storage Management process
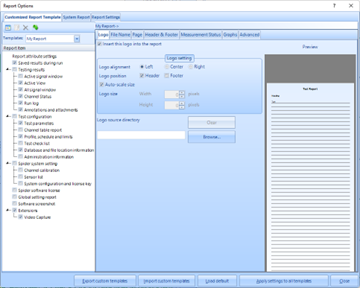
Generate reports:
Both product lines allow users to export customizable reports for each iteration of data acquisition. These report formats can be standardized and are identical for both the Spider and CoCo systems.
|
|
Post process data:
The collected data can be exported as various file types for post processing (see Export the files). However, Crystal Instruments also offers the powerful Post Analyzer (PA) software.
To learn more about PA, visit:
Want to know more about how our products and team can help you reach your goal? Reach out to us here.