
Variance Reduction for Random Vibration Testing
Introduction
It is widely acknowledged that a large average number of frames is utilized for random vibration control. The MIL-STD 810H, for instance, mandates the use of an average number of 60 frames, or 120 DOF in other words. Employing such a significant number of averages often results in a control spectrum with relatively low variance. In the time domain, each frame is computed and transmitted. However, within each frame, the variance tends to be considerably high. Through exponential averaging in the process, this variance is effectively attenuated over time or across the number of frames. This method is a conventional practice in random vibration control.
In certain environmental testing scenarios characterized by brief durations, such as satellite testing, it may not be feasible to reach the required number of averages. Consequently, the control spectrum may exhibit pronounced variance. In such cases, activating variance reduction processing can mitigate this issue, yielding a control spectrum with comparatively lower variance.
The computation of variance in a random signal is based on its statistical properties. Once determined, the variance can be mitigated or eliminated from the final Power Spectral Density (PSD) spectrum. This Variance Reduction option allows users to obtain a smooth PSD spectrum without using lengthy averaging processes.
Variance reduction does not alter the core mechanics of the control loop. Instead, it focuses on reducing the variance in the computation of the control PSD. As a result, the resulting control spectrum adheres more rapidly to stringent alarm limits, which proves particularly advantageous for extremely brief test durations.
Variance
The function g(x) of a random signal (process) x(t) with a probability density px (x) defines the expected value E[g(x)] with the following:

Directly from the preceding equation, the expected value of x(t) is defined with the following:

These are similar to calculating the center of gravity in one dimension. The expected value, or average value, is essentially the ‘amplitude center of gravity’.
The estimator of the mean value based on N samples of x(n), n = 1, . . . , N, is defined by the following:

which is a consistent estimator, i.e., the variance of the estimate approaches zero as N approaches infinity. Note that we either use the ‘bar’, ¯ x, symbol or the hat symbol combined with the symbol of the true estimate in μˆ x .
The variance,

of a random variable, x(t), is defined by the following:

The square root of the variance, i.e., σx, is called the standard deviation of x.
Variance in Drive and Vibration Test Control
For random control, the following equation governs the drive and control signals,
Ctrl(f) = H(f) * Drv(f)
Each frame of drive will result with a frame of control similar to the following graph:

The Ctrl spectrum is the instantaneous spectrum, thus with whole variance. The green target is the profile which is of no variance at all.

The system frequency response function has a sufficient average number; thus, it is a stationary spectrum of no variance. This makes sense because the system FRF has structural characteristics.

The drive spectrum is also from the momentaneous frame, which illustrates the same amount of variance as that of the Control spectrum.
Notice that the FRF between a response and drive can be modelled as a constant without introducing additional variance into the response. The variance of an instantaneous control spectrum is identical to an instantaneous drive spectrum. During the control process, the drive spectrum is known before the drive time signal is sent out. If we take the known variance of the drive spectrum into consideration and compensate it to the control spectrum, the variance of control spectrum can thus be reduced.
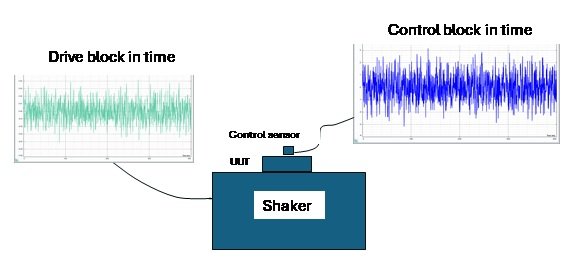
The preceding graph demonstrates that the drive and control blocks in time are both instantaneous and have a naturally higher level of variance.
The high number of averages produces a control spectrum that is more convergent with less variance. Hence, the control spectrum is a display of the control spectra from many frames, while the APS spectrum of the control channel is at a certain moment. These are fundamentally different.
Variance Reduction in Vibration Testing
Given the statistical availability of variance data, it becomes feasible to diminish variance by a certain extent, thereby facilitating the generation of a considerably smoother control spectrum even with a reduced number of averages or in a significantly shorter duration.
Integrating variance reduction into the process results in a notably smoother control spectrum that closely aligns with the desired profile. Users are granted the autonomy to activate or deactivate this feature according to their preference.
When variance reduction is enabled, it effectively reduces the variance of the control spectrum by 50%. This substantial reduction accelerates the convergence of the control spectrum, sparing the need for prolonged averaging processes and extended testing durations.
Variance reduction operates independently of the core control process. Its sole function is to mitigate the variance within the control spectrum, thus producing a smoother output control spectrum. The subsequent graphs depict the impact of variance reduction, both at -6 dB level and 11 seconds into the test, demonstrating its efficacy.
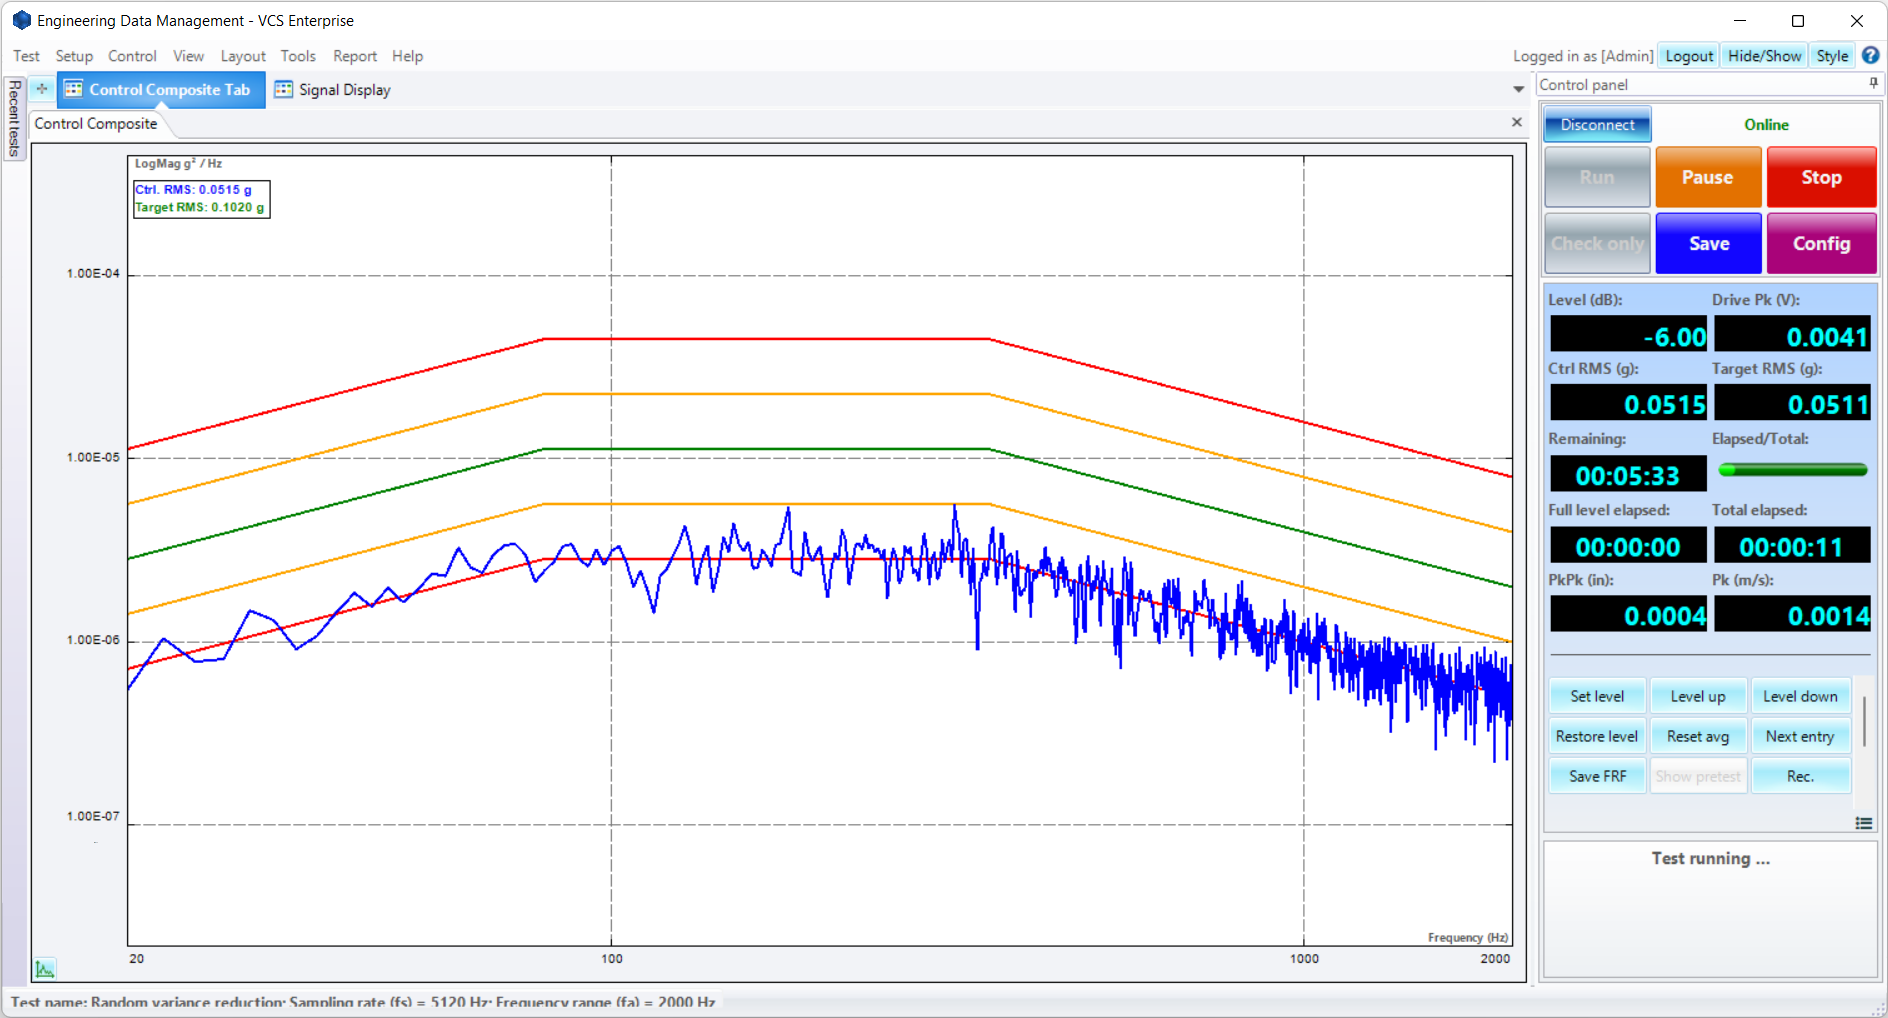
Figure 1. Without variance reduction

Figure 2. With variance reduction