
Vibration Visualization (DSA)
It is difficult to imagine the actual vibration level and distribution from the numerical display or the signals which are basically a mathematical representation of the vibration experienced by the structure under test. Animating the structure’s deformation helps to get a better picture of the intensity of vibration. A contour scale which graphically displays the magnitude of vibration on the structure using a color plot helps in visualizing which areas of the test unit is experiencing maximum and minimum magnitude of the vibrations.
A 3D geometry model of the structure under test is required to animate the vibration it is experiencing. It is tricky to create a 3D model of intricate geometries because of the complexity involved in measuring the x, y, z coordinates of the test article and using this information to generate a model with lines and surfaces.
The vibration visualization approach proposed by Crystal Instruments not only helps in overcoming the difficulty of producing 3D geometries of any complicated models with a simple procedure but also animates the structure’s deformation which makes it possible to visualize the vibration experienced by the testing article during a vibration test.
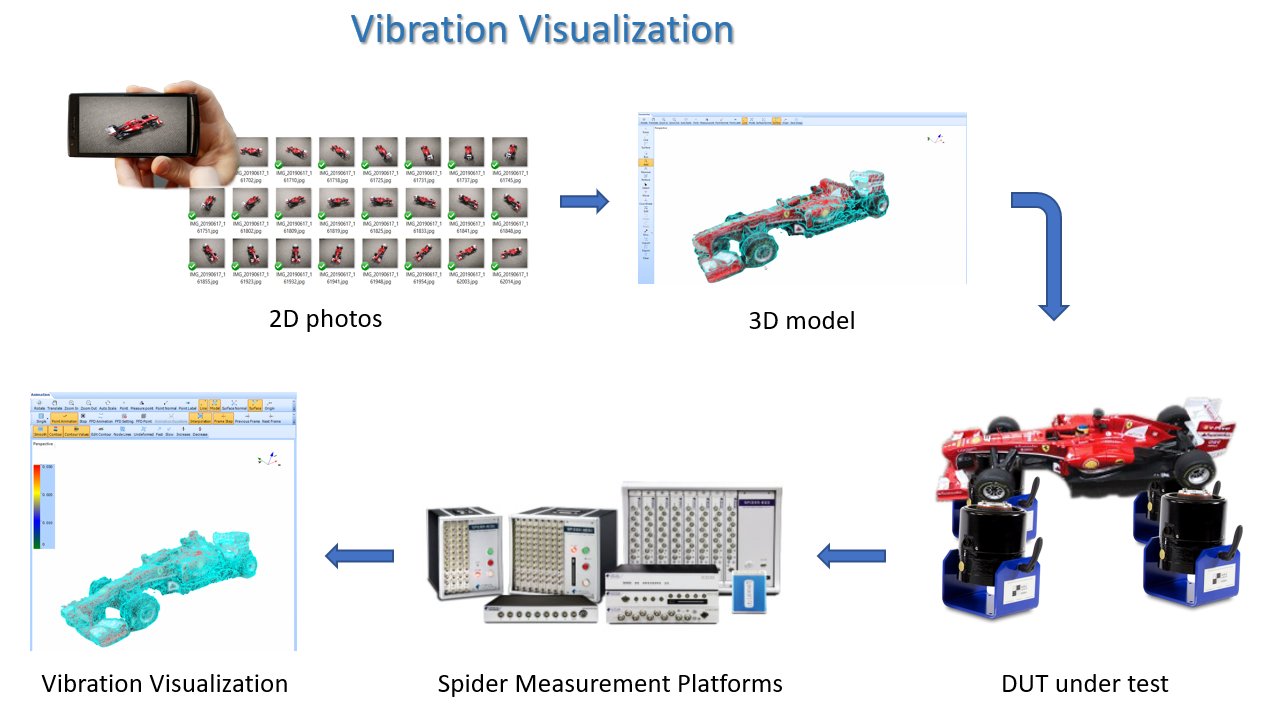
Figure 1 - An overview of the proposed Vibration Visualization procedure
As illustrated in the diagram above, a series of 2-dimensional photos taken from a smartphone are used to construct a real 3-dimensional model of the object. The object is put under a vibration test, while the vibration can be visualized in real time using the real 3D model.
The vibration visualization of the 3D model can be performed in real-time while the measurement is ongoing. The real-time animation uses the point data of the input channels (sensors) to display the deformation of the test article during the vibration test.
There are three ways of generating a three-dimensional geometry model of the structure under test.
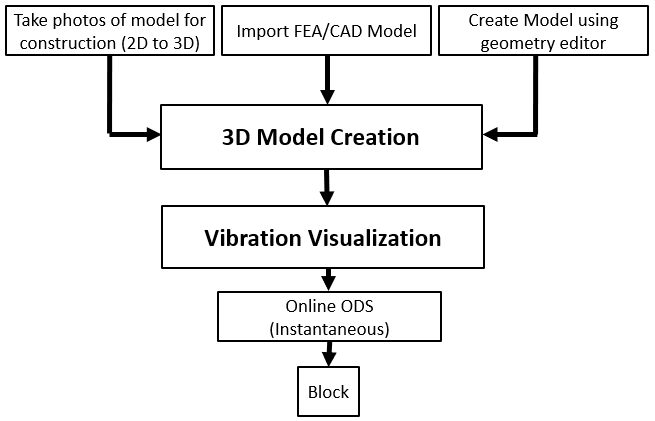
Figure 2 - A schematic flowchart of the Vibration Visualization process
Crystal Instrument’s 3D Model Reconstruction software uses the advanced technology of 2D to 3D reconstruction to provide a simple solution to the intricacies of creating 3D geometric models of convoluted test structures. This approach not only saves the user time and effort but also provides an accurate model with great simplicity. The user simply takes photos of the test article and feeds it into the software. These images are matched to extract the features and a 3D model of the structure is constructed after the point and surface reconstruction processes. This method is extremely easy to use, does not require any manual labor and is much quicker than the other two approaches.
The following steps briefly explains the working principle behind the 2D to 3D reconstruction procedure.
Capture photos

Figure 3 - Captured Images of the test structure
The user takes 2D photos going around the testing object. The photos can be taken using a smartphone or a camera. To obtain an accurate 3D model it is suggested that the user takes photos at every 15 degrees which corresponds to approximately 24 photos of the test object. Increasing the number of photos will improve the accuracy of the model but may increase processing time.
2D to 3D reconstruction in Crystal Instrument’s 3D Model Reconstruction software
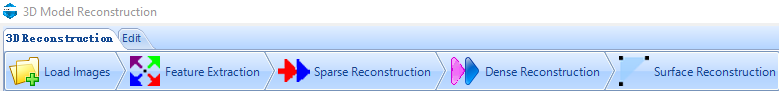
Figure 4 - A screenshot of the processes involved in 2D to 3D reconstruction procedure
1. Load Images
The 2D photos are imported into the reconstruction software to match the images and extract the features.
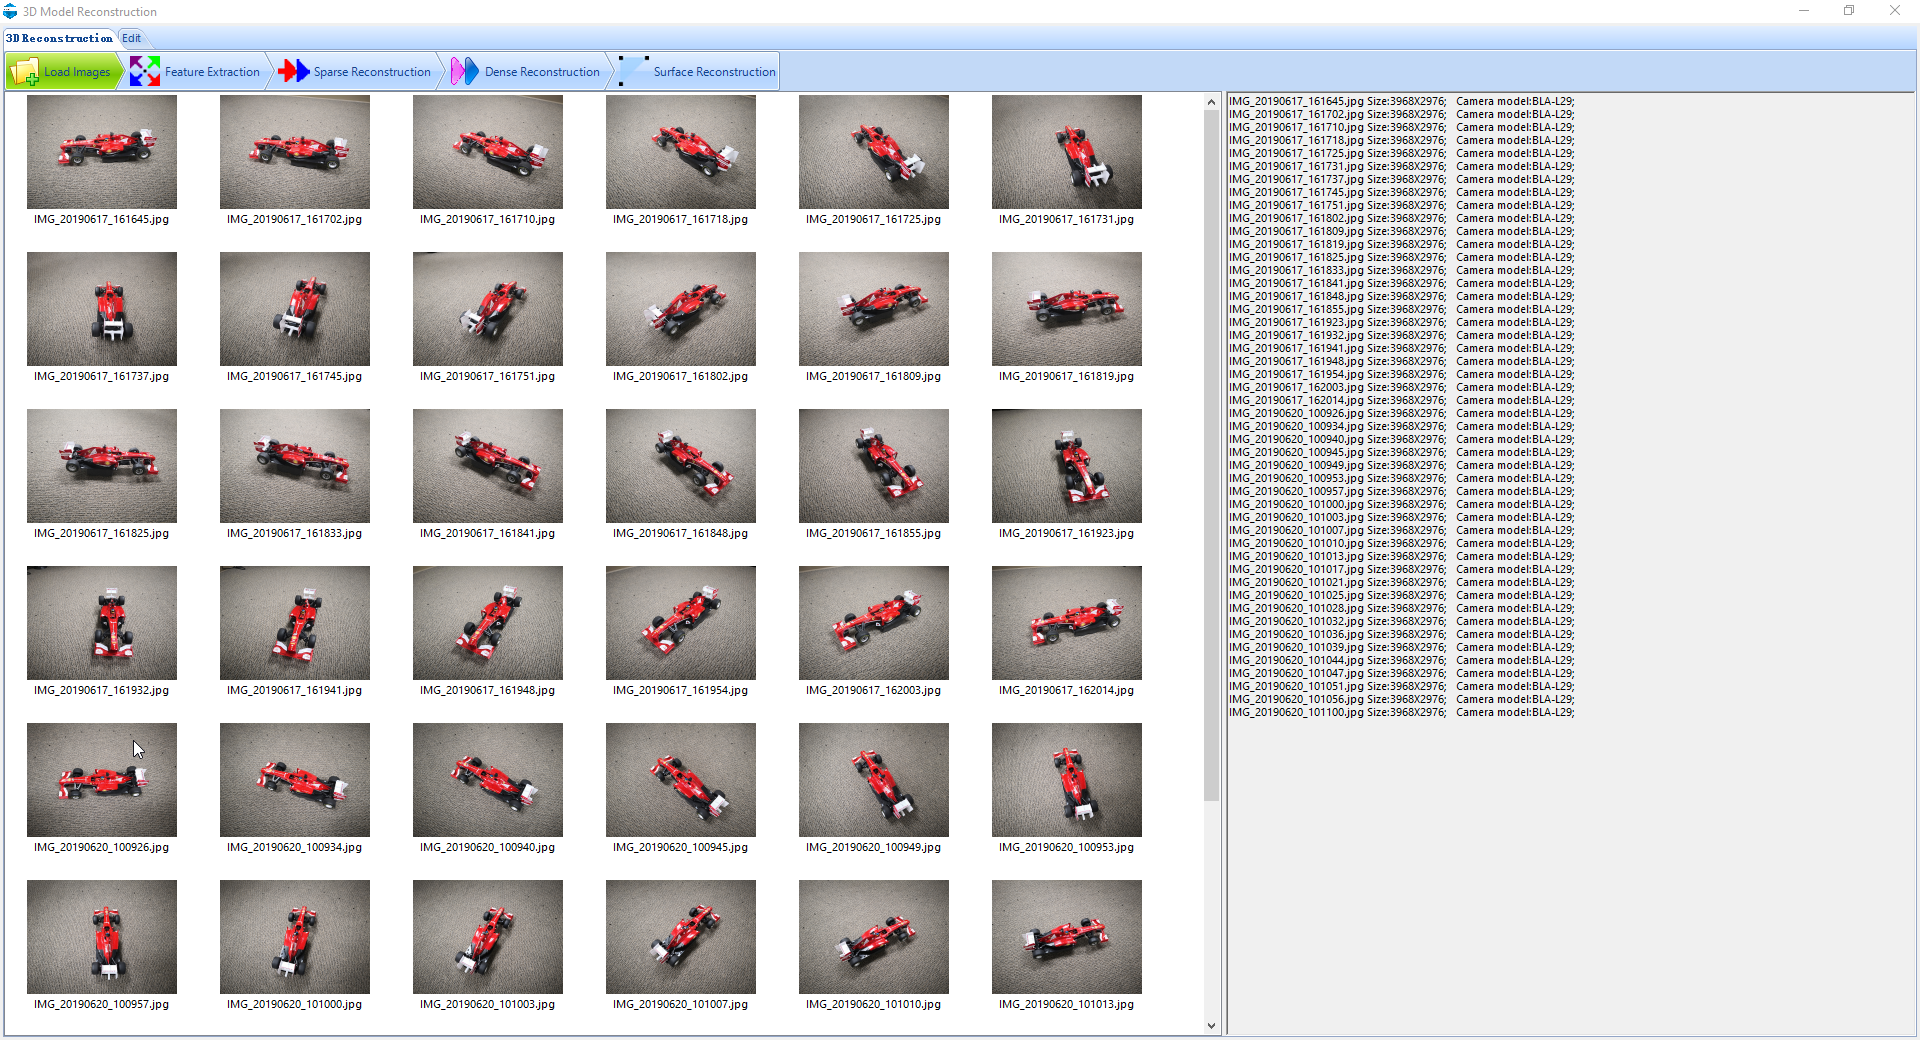
Figure 5 - Images loaded into the EDM 3D Reconstruction software
2. Feature Extraction
Based on the triangulation principle, two corresponding photos are used to determine the depth of the test object. The 15-degree interval helps in obtaining an optimal overlap between consecutive images which further improves the image matching.
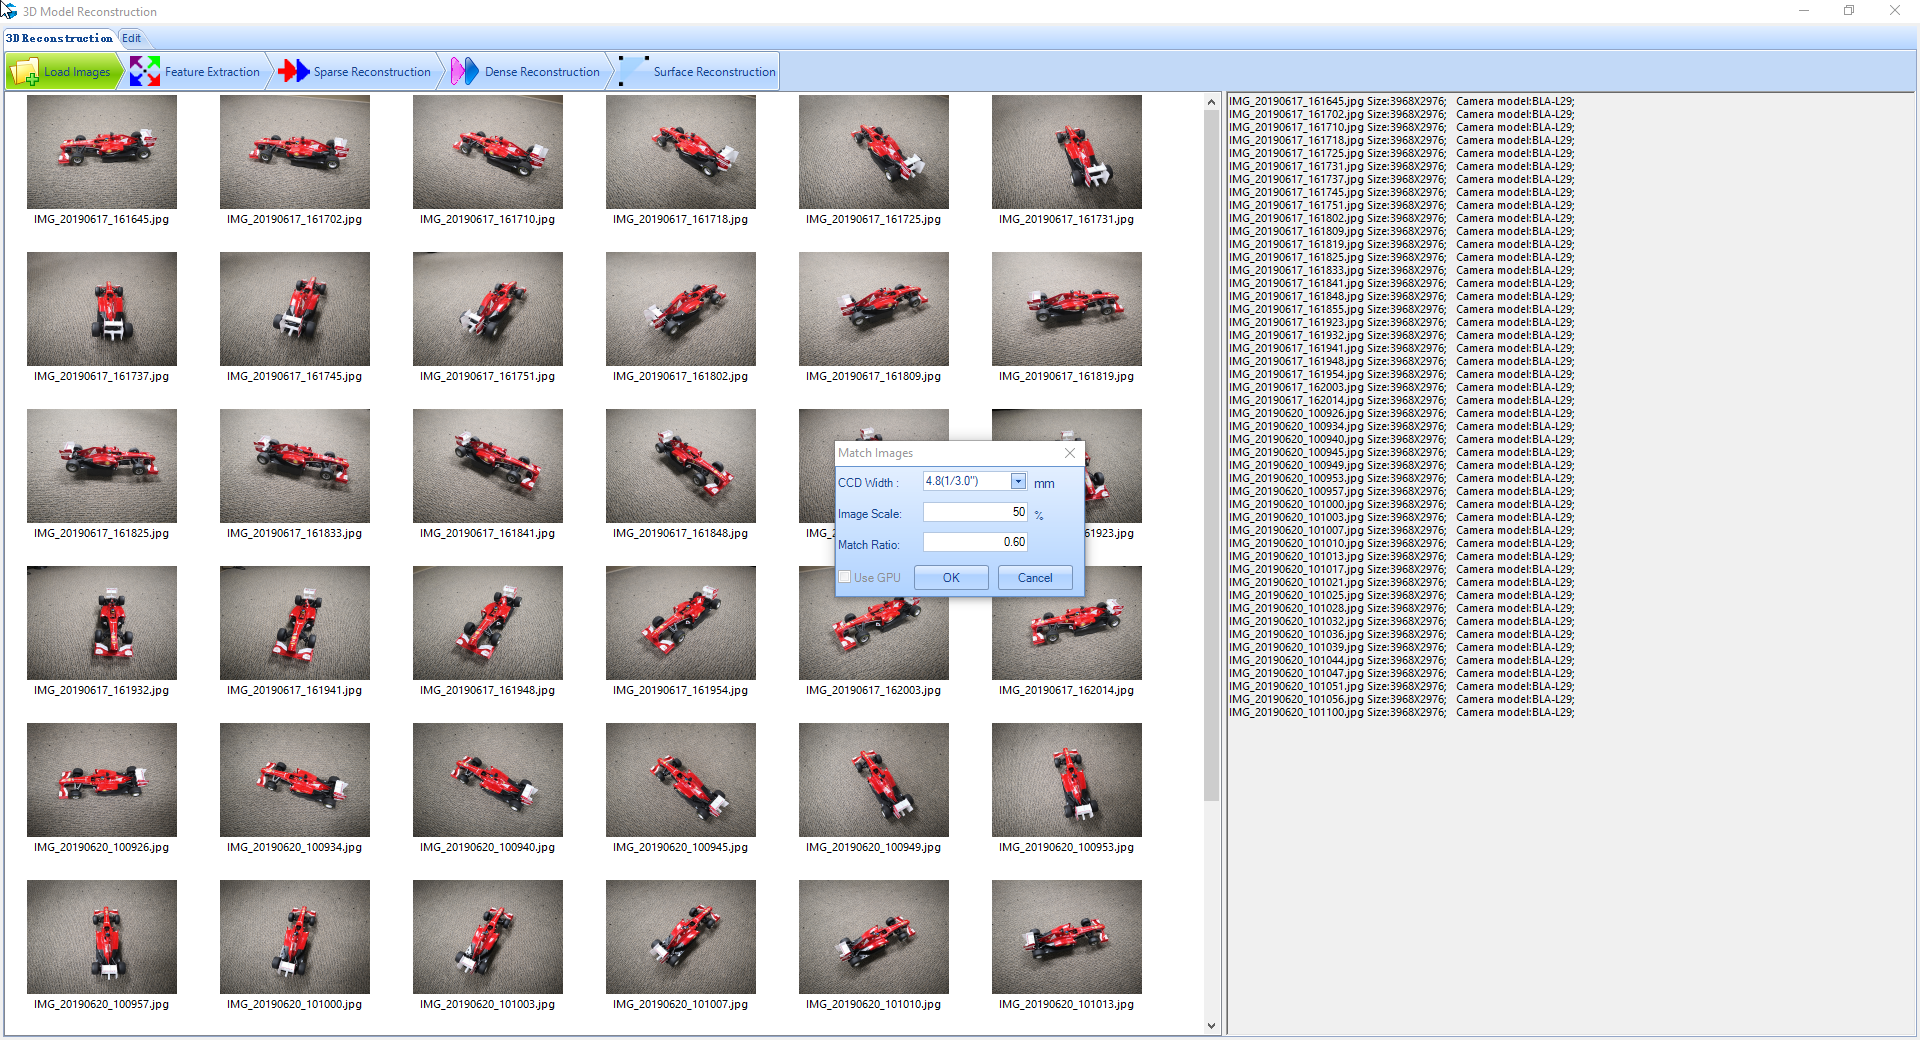
Figure 6 - Parameter setting for Feature Extraction process
The CCD width is determined by the number of pixels in the photo and the focal length of the camera. A higher number of pixels and larger CCD size implies a better resolution of the photo. The image scale basically implies if the photos are rescaled to complete the image matching process. The default match ratio of 0.6 should be enough to obtain a good match between the images. This is a suitable balance between good image matching and the fast feature extraction process.
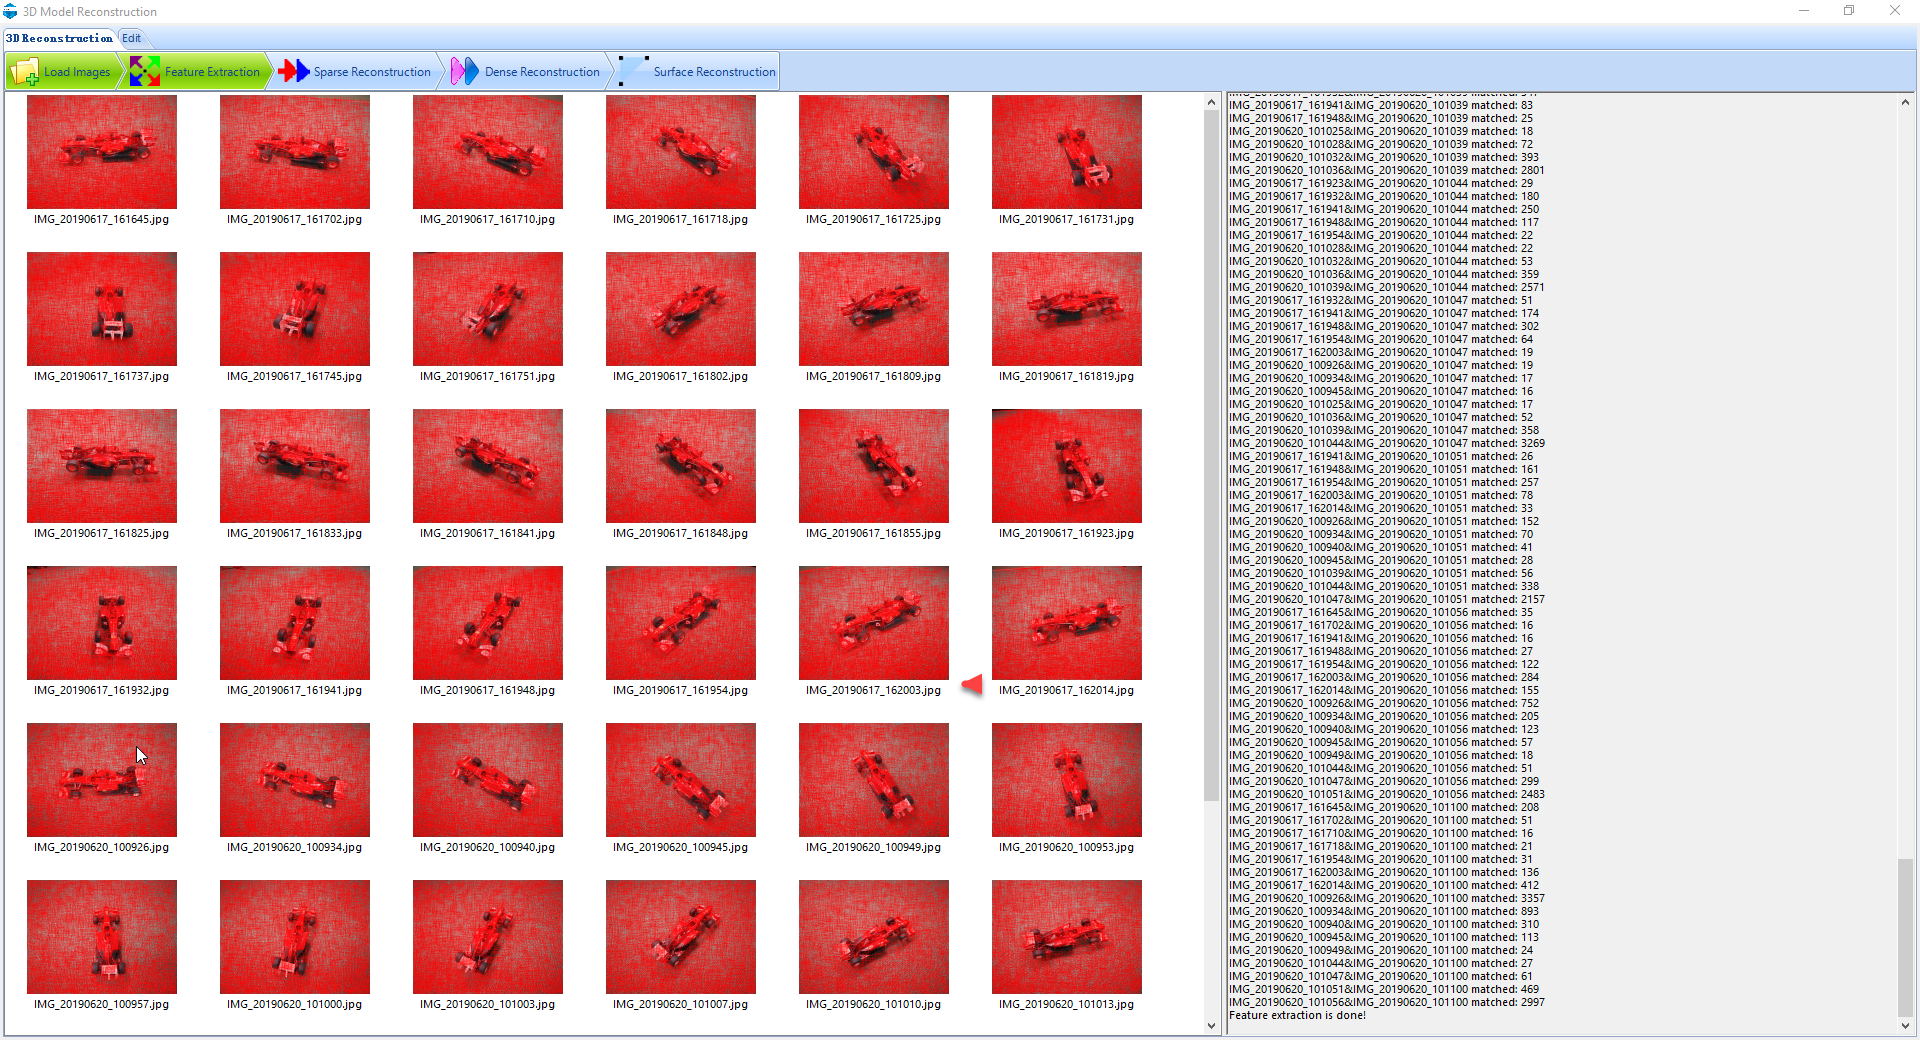
Figure 7 - A screenshot of the completed Feature Extraction process
3. Sparse and Dense Reconstruction
Detecting the key features from the images helps in creating a sparse point model of the test structure. This is a fast and rough model creation before the constructed point geometry is fine tuned in the dense point reconstruction procedure. The initial image pairs to begin the spare point model reconstruction can be automatically chosen by the software.
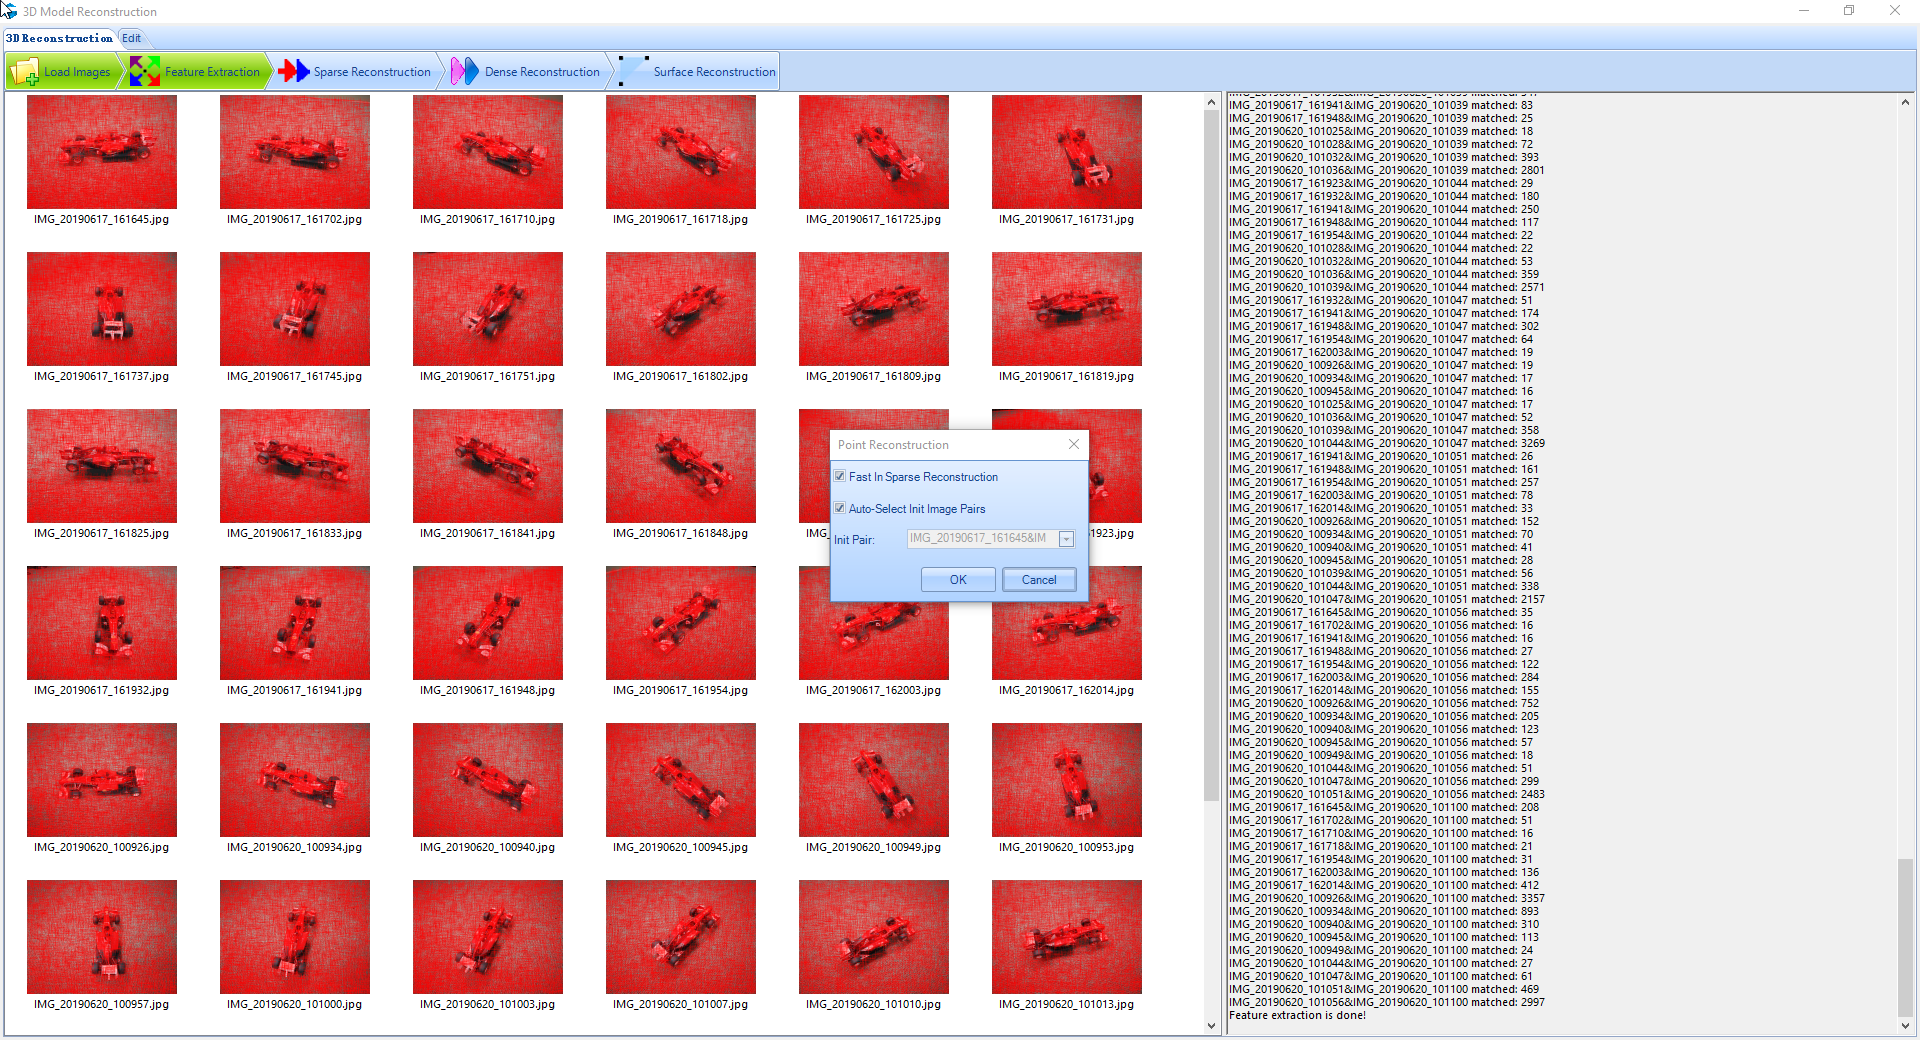
Figure 8 - Settings for Spare Reconstruction process
More information from the feature extraction and sparse point reconstruction is used to generate a dense point 3D model.
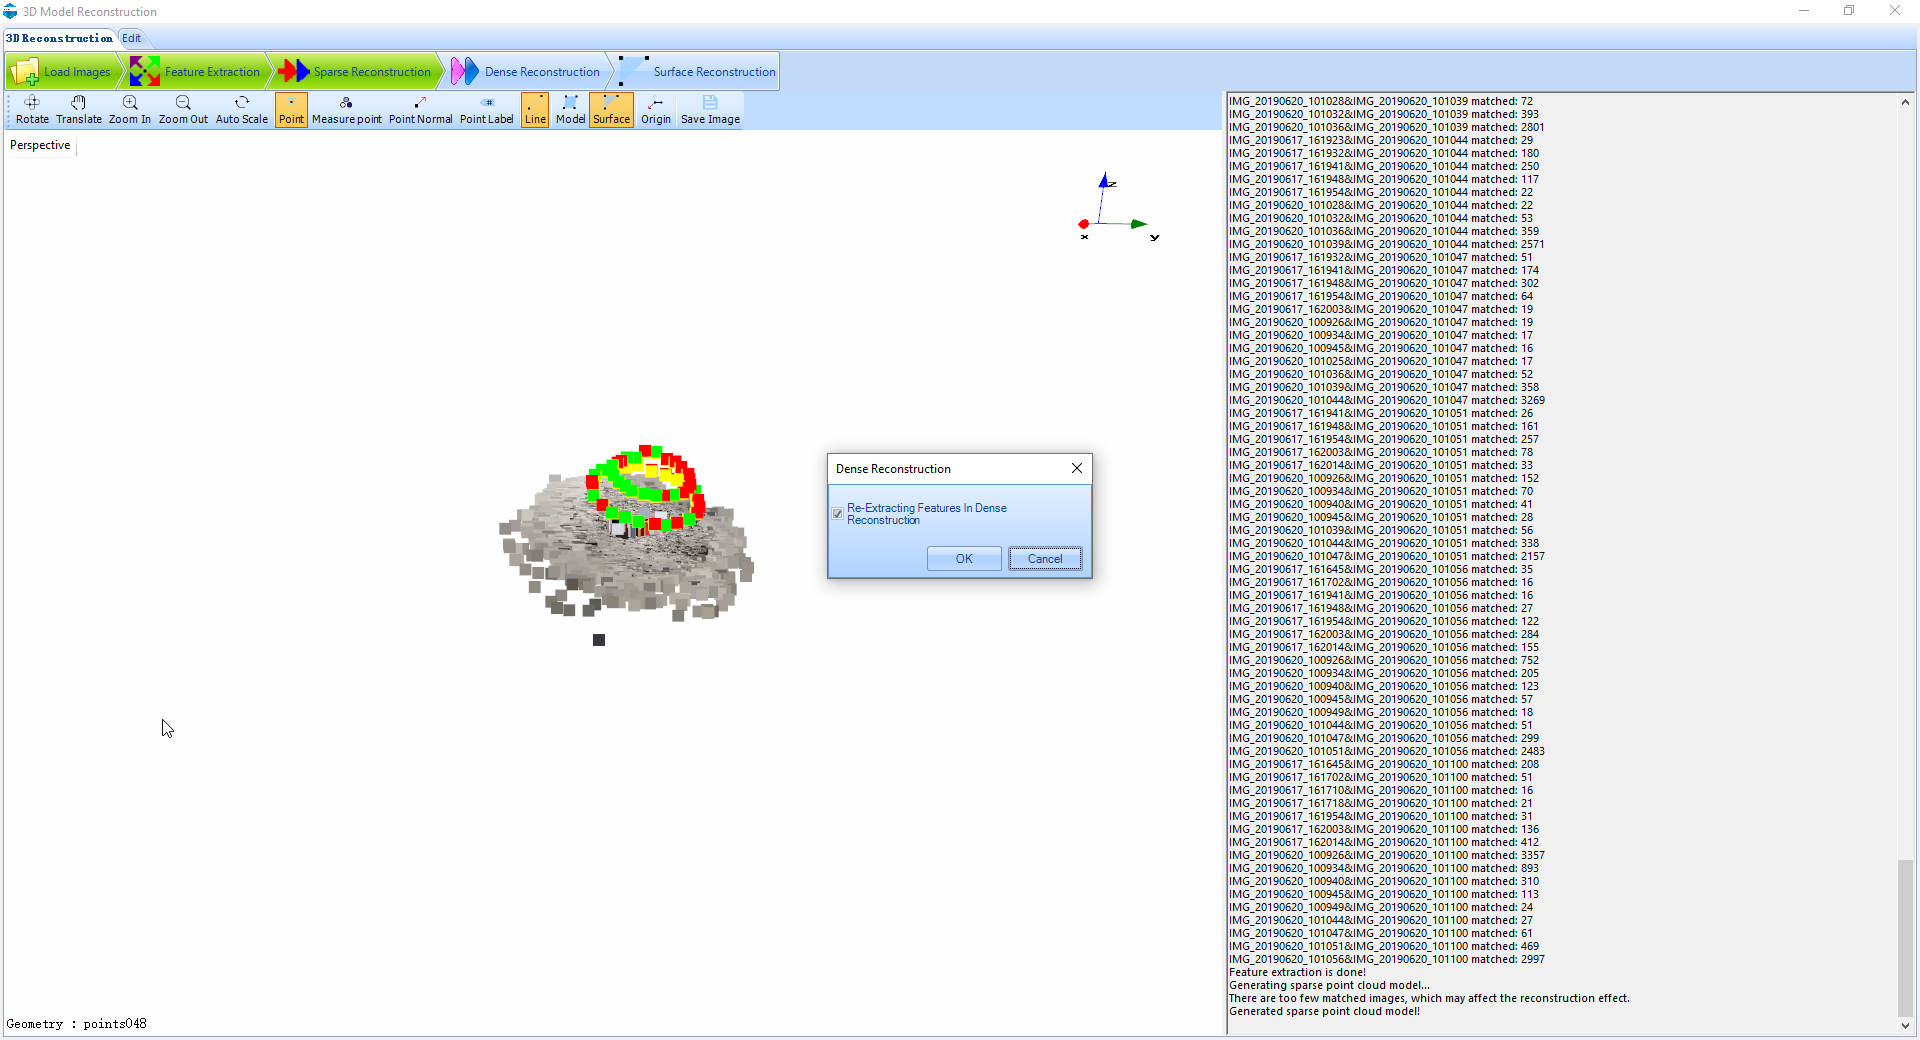
Figure 9 - Prompt for Dense Reconstruction process
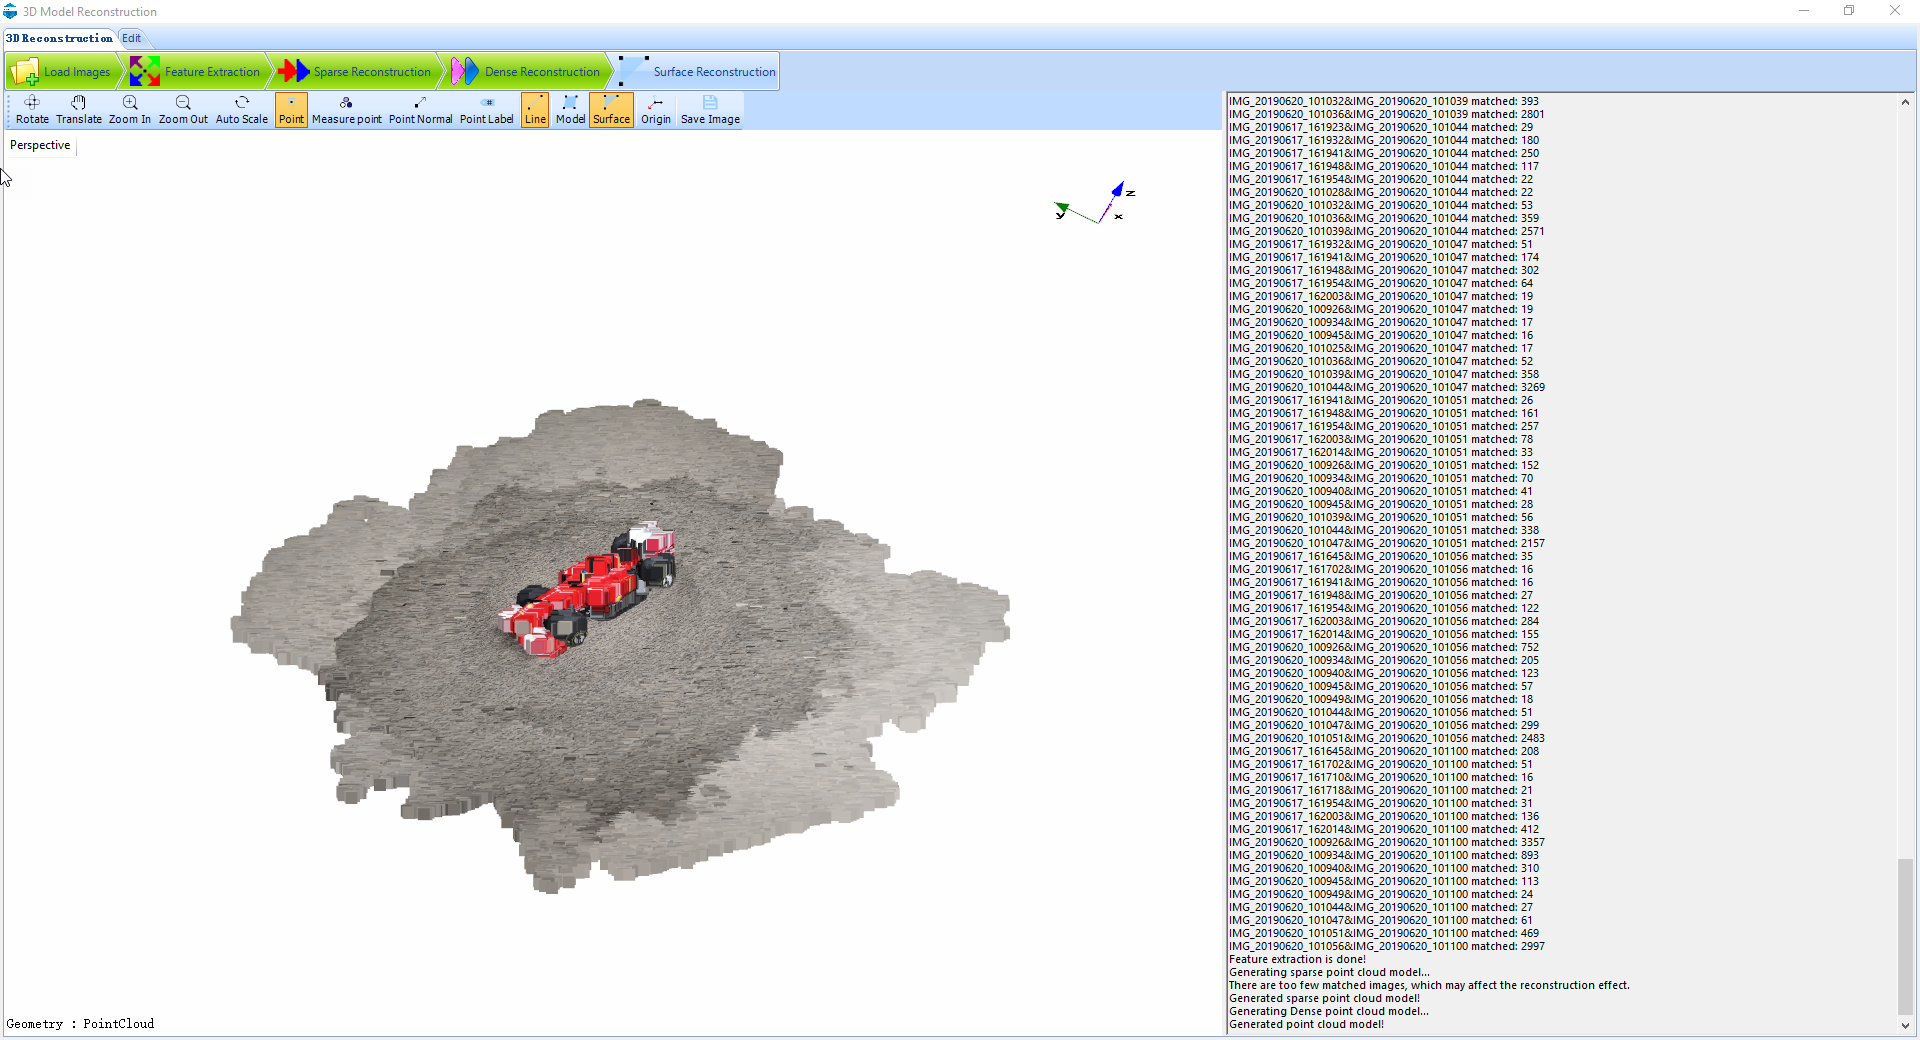
Figure 10 - A screenshot of the dense point constructed model
4. Surface Reconstruction
A complete 3D model is produced in the surface reconstruction stage by automatically joining all the points in the penultimate dense point model.
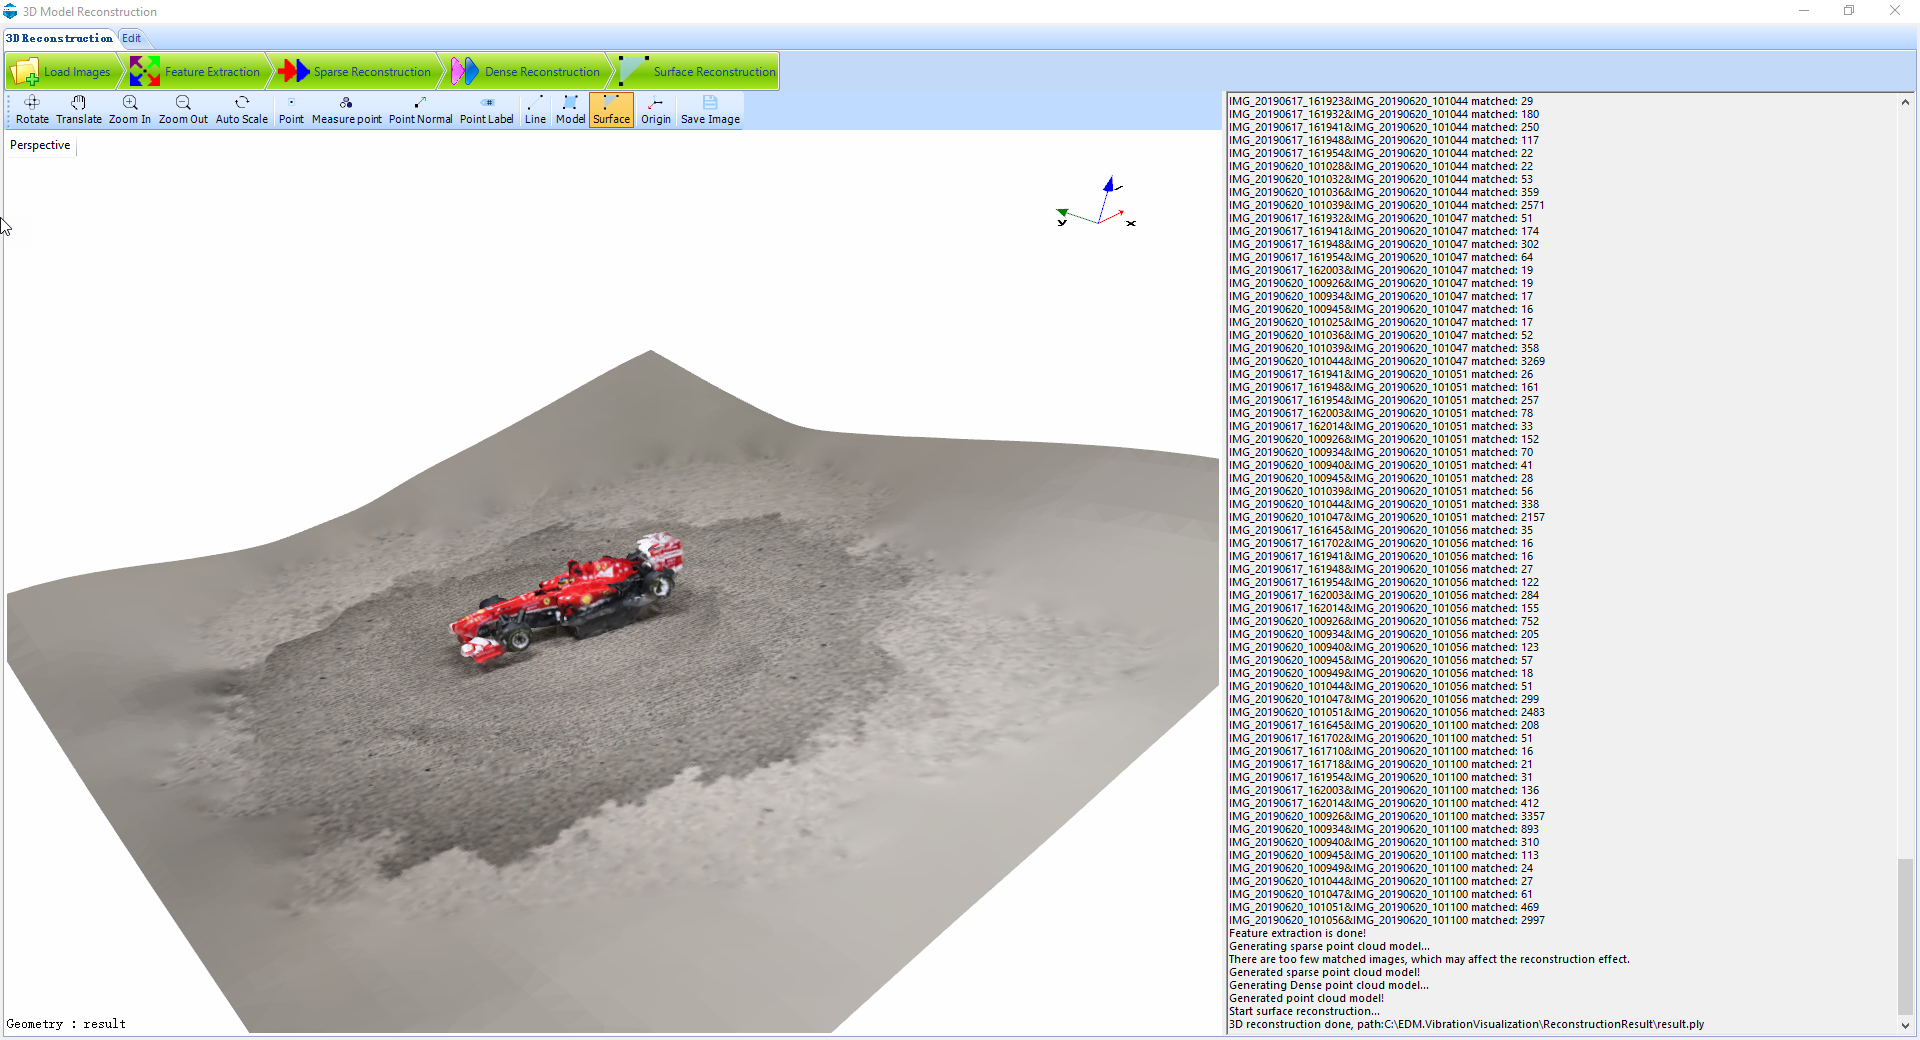
Figure 11 - A screenshot of the completed surface reconstruction process
5. Geometry Editor
Once the 3D model is in the Geometry Editor, various features in the software can be used to trim and modify certain sections of the 3D model to improve the aesthetics of geometric model. One typical operation is to remove the floor for the above race car model. This model can then be exported to a. vvm format and imported into any of the EDM Modal, VCS or DSA software’s for the vibration visualization application. The EDM DSA application is discussed here.
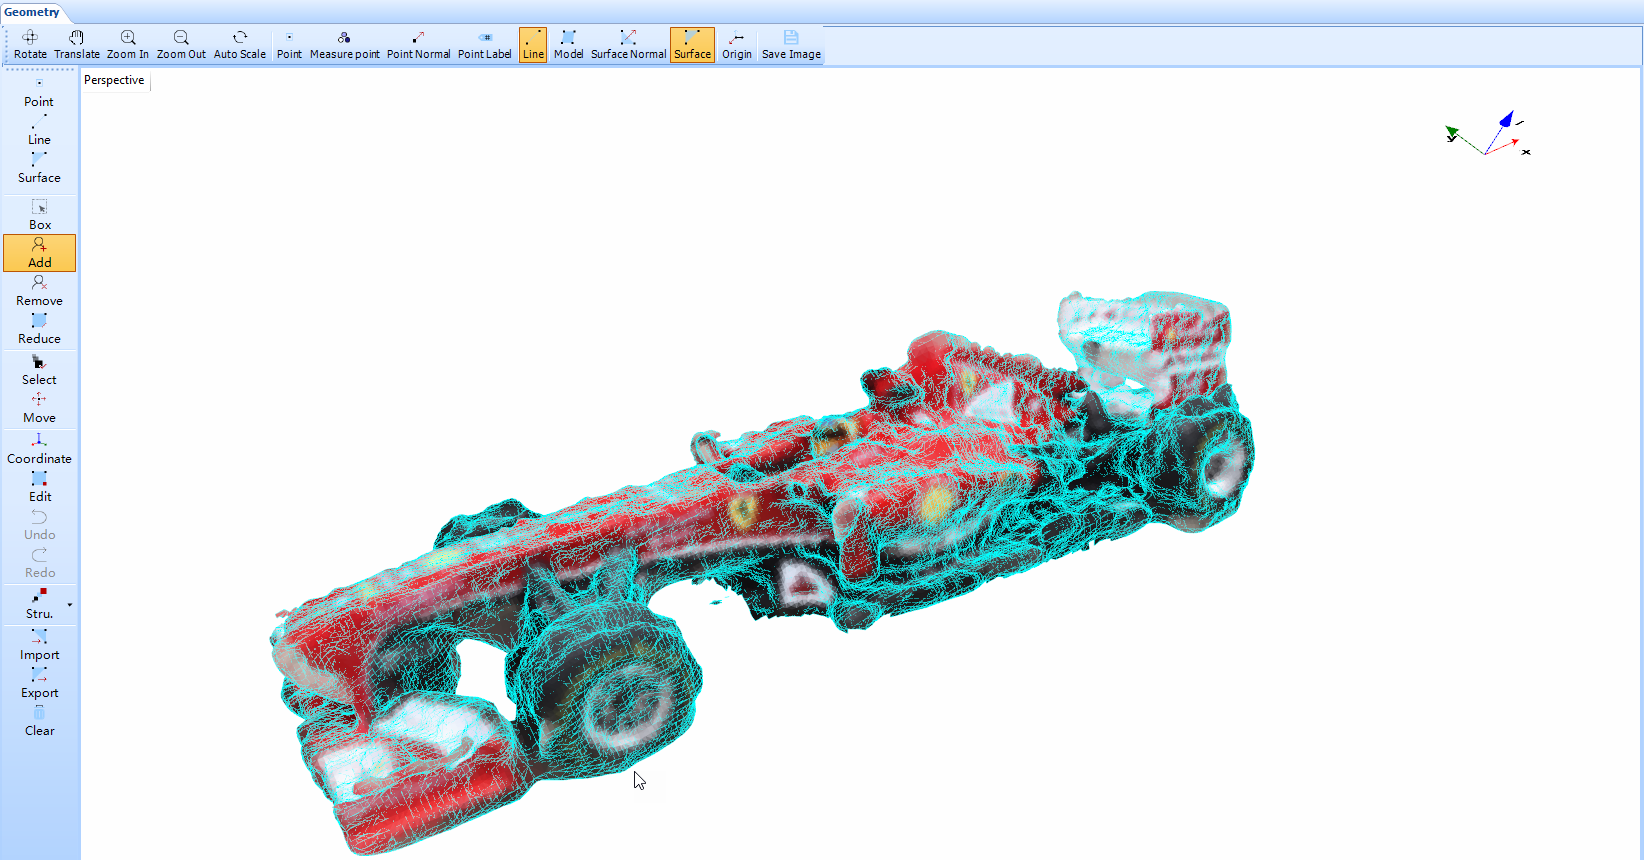
Figure 12 - The final 3D model
The constructed 3D model is used to visualize the vibration of the test structure in real-time (Online Visualization) when the measurement is going on. This is discussed in detail in the next section.

Figure 13 - A general overview of the testing process for a reconstructed 3D model
Using the 3D model created, the vibration visualization can be carried out while the vibration test analysis is ongoing. After attaching sensors onto the test structure at different measurement points, a vibration test is carried out. The data acquired at these sensor locations is used to animate the vibration of the 3D model at these measurement points. The measured data set can be used to perform global interpolation and calculate the deformation of the unmeasured points spread across the entire structure. This greatly simplifies the process of measuring data at all the points. The vibration visualization feature collectively provides the animation of the test structure at these points on the constructed 3D model.
When a 3D model is available, the data from the signals can be used to animate the instantaneous deformation of the structure. Information from this vibration visualization and the contour plot scale can be used to optimize the location of sensors as the user knows which section of the testing article has higher or lower deformation. Similarly, this knowledge can also be used to change the excitation location to obtain an optimal response at the desired locations.
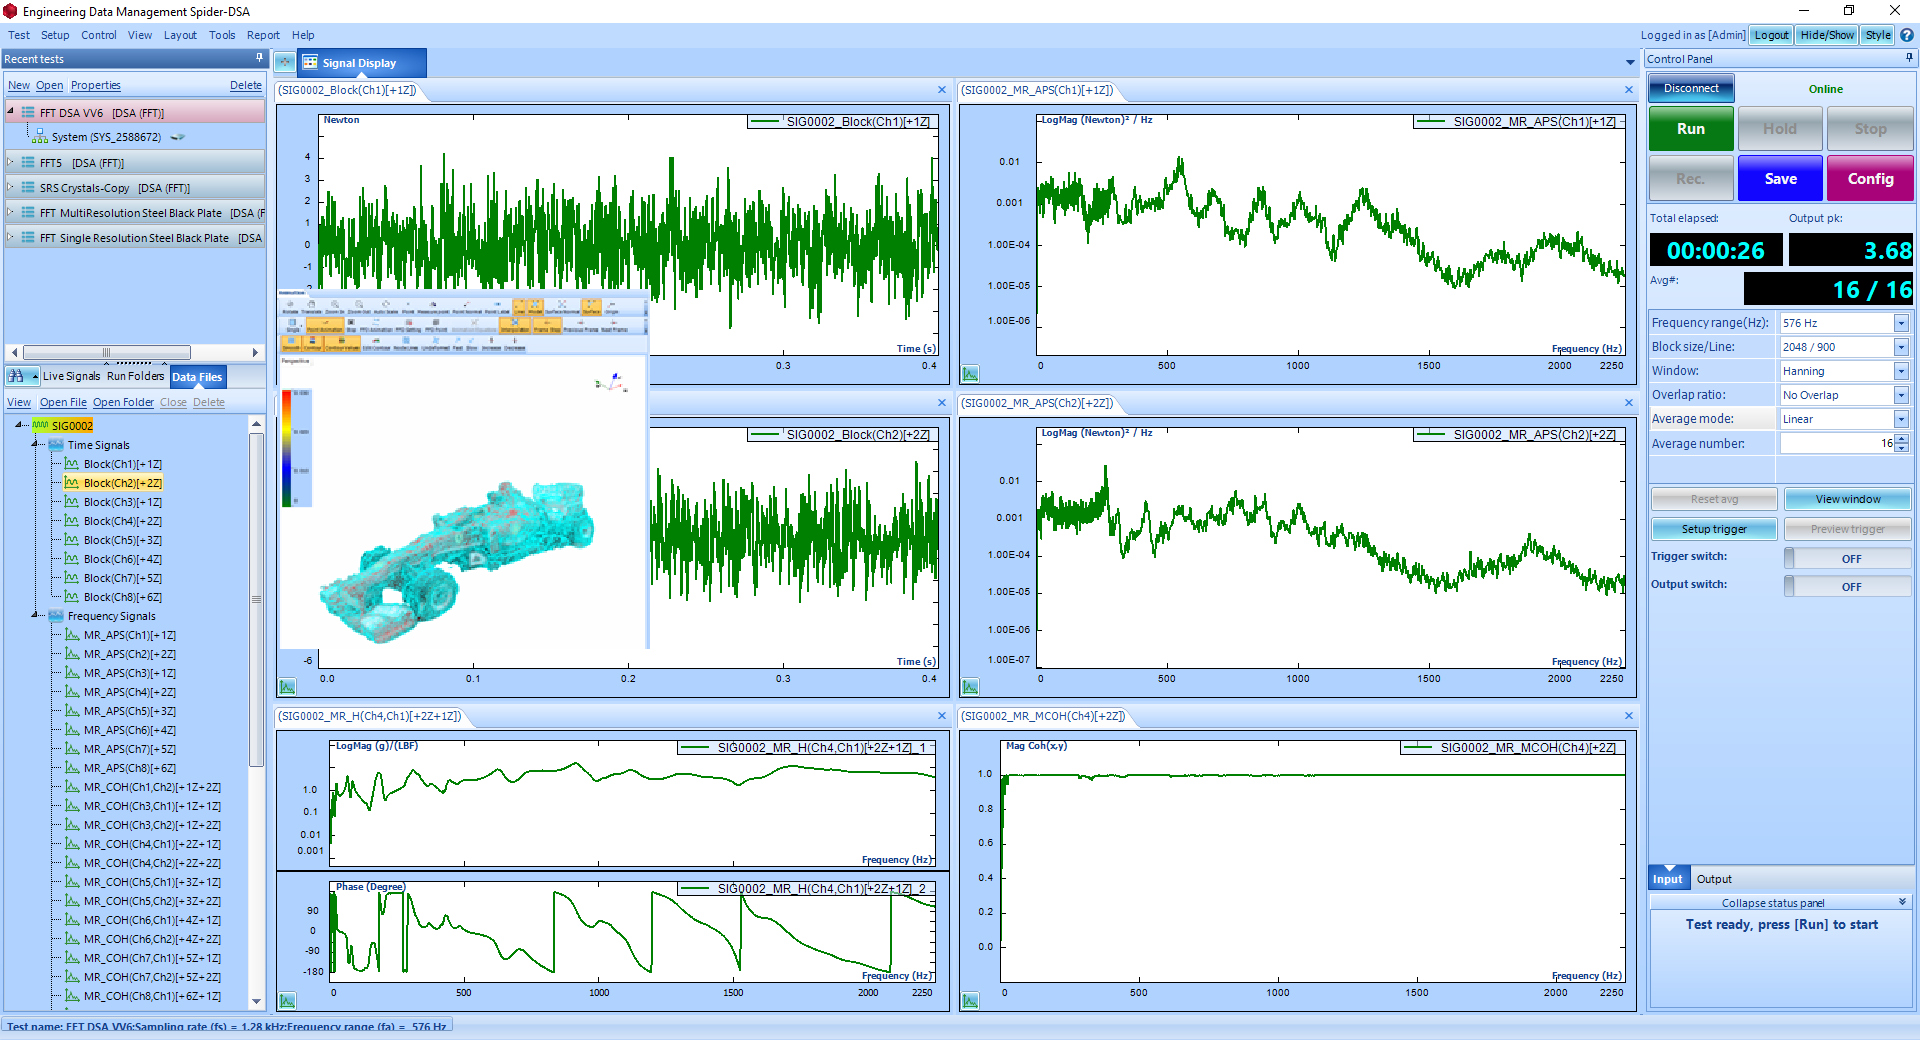
Figure 14 - Vibration visualization of the test structure’s operational deflection shape in real time
The online vibration visualization feature uses block data from the input channels to animate the deformation experienced by the test structure at these sensor locations. The block data is useful for a more instantaneous display of vibration visualization of the structure under test. The animation is updated every 40 milliseconds when the block data of the sensors is used for visualizing the vibration of the test article.