
Kurtosis Control in Random
Single Axis Shaker Vibration Testing
Kurtosis measures the frequency of large peak occurrences in a waveform. Kurtosis control allows the user to specify the target kurtosis of the random control signal, and the controller will adjust the amplitude distribution of the vibration to match the target. This is done with minimal effect on the frequency content and dynamic range. Possible kurtosis values are 3 - 10. Supports up to 512 input channels.
Click to enlarge - Kurtosis Control in Random
Kurtosis Control in Vibration Testing
Kurtosis control in the Spider Random test mode controls the amplitude distribution of the random vibration. With Kurtosis control, more realistic tests can be conducted that better simulate real-world environments.
In the real world many kinds of vibration environments are characterized by signals that have high kurtosis value (relative to Gaussian random). The fatigue and damage potential for these vibrations are higher than for a pure Gaussian replication of the environment. Hence using the traditional Gaussian random signal as the test signal will actually under test the product for its service environment.
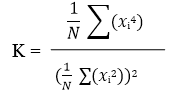
Kurtosis can be expressed as a normalized value “K” by dividing the fourth statistical moment divided by the square of the second statistical moment. The equation below shows the K calculation for N samples.
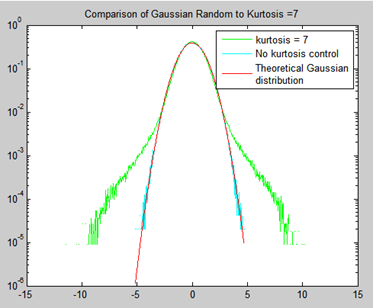
Without kurtosis control, the output distribution of the random controller is Gaussian. This means that large peaks are relatively rare; the random waveform will be less than 4 times its RMS value 98% of the time. Real-world vibration, such as the vibration in a car driving over rough pavement, often has peaks 5 to 10 times the RMS level. Kurtosis is a measure of this "peakedness" and is related to the amplitude distribution. A random vibration with higher kurtosis will contain more "outlier" peaks in the extremes of the distribution. A pure Gaussian distribution always has a Kurtosis of 3, while real-world vibration may have a kurtosis of 5 to 8.
By increasing the kurtosis of the random vibration to match the kurtosis of anticipated real-world vibration, the vibration test will more closely match the actual environment.
The figure below shows the difference in amplitude distributions of the tests. Amplitude distribution can be measured with histograms. It can be seen that the tails extend out much farther with the higher Kurtosis. The controller changes this amplitude distribution by adjusting the phase of the randomly generated drive signal. Since only the phase is changed, there is no effect on the frequency content of the vibration.
Continuous Data Recording
During vibration control, all measurement input and drive signals can continuously record to a Spider-NAS or the internal storage residing in each front-end. Users can view and analyze data files with Crystal Instruments Post Analyzer. The variable sampling rate can be enabled to simultaneously record slow-change signals together with high speed vibration data.
Vibration Utilities App
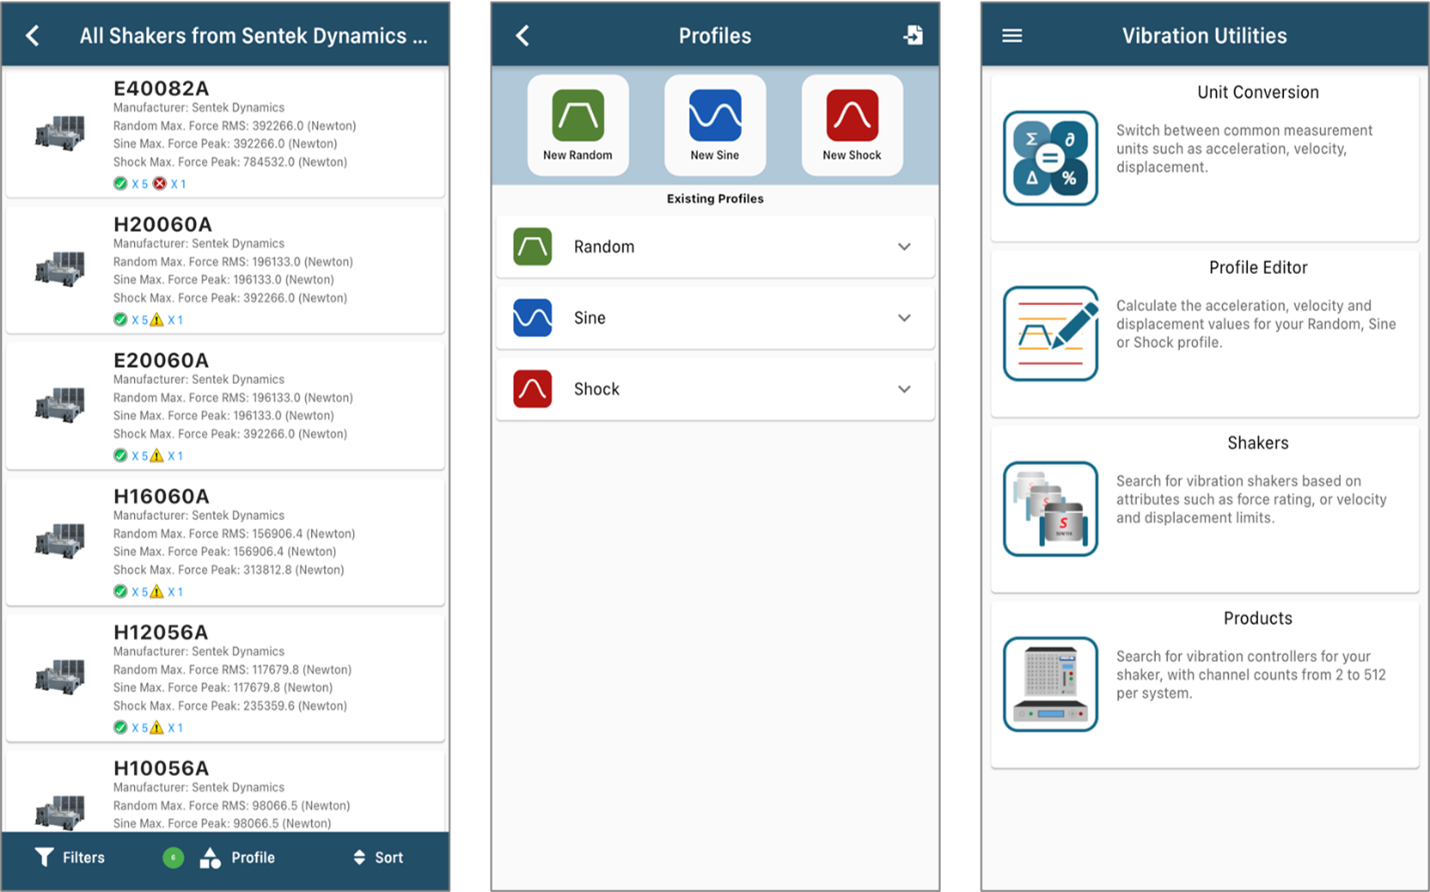
Crystal Instruments in partnership with our sister shaker company Sentek Dynamics provides users with the Vibration Utilities mobile app on iOS and Android. This app provides calculation features for sizing your vibration profile (Random, Sine or Shock) and searches through our catalogue of shakers and controllers for the best fit.


Drive Notching/Limiting for Random
Limiting is applied to control or monitor channels. Three types of limiting are available in Random Control: frequency domain, time domain, and advanced limit. Frequency domain limiting is spectrum limiting. Limit types are notching limit, abort limit, and alarm limit.
Time domain limiting compares raw data or the RMS value of input channels to the high limit. The occurrence of exceeding the high limit is one of the system events to which desirable actions can be added.
Advanced limit includes summed channel notching and vector notching. A summed virtual channel is defined as the weighted average of raw time stream signals from multiple input channels. The notch profile of a summed channel is defined in the frequency domain.
A vector RRS signal is defined as the vector sum of raw time stream signals from 3 input channels. The notch profile of a vector RRS signal is defined in the frequency domain as well.
Supports up to 128 notching/limiting channels out of 512 input channels.
Multi-Resolution for Random Vibration Testing
EDM provides the powerful multi-resolution feature that applies the selected resolution in the high-frequency range and 8 times of the resolution in the low-frequency range. The cut-off frequency, which divides the low and high-frequency range, is calculated by the software.
Vibration Testing Hardware
- Spider-81/81B Vibration Test Controller
- Spider-80Xi High Channel Vibration Test Controller - Scale up to 512 Channels
- Spider-80X Dynamic Measurement & Vibration Control System
- Spider-80M - MIMO Vibration Test Control System
Related Vibration Testing Software Options
- Random Vibration Testing
- Mixed Mode Vibration Testing
- Kurtosis Control for Vibration Testing
- Fatigue Damage Spectrum in Random Vibration Testing
Monitoring Through EDM Cloud
All vibration tests in EDM-VCS support status checks through EDM Cloud. With EDM Cloud support, users can set up any VCS test to upload live data or run logs for completed tests to a cloud storage space provided by Crystal Instruments, where data is securely stored in the user’s account.
The EDM Cloud website is located at https://cloud.go-ci.com. Users can access EDM Cloud from anywhere in the world to check the status of past and current tests. A secure login flow ensures the status can only be checked by authorized personnel with proper credentials. Multiple logins for accessing the same Cloud account is available.
|
|
|
|
|
|
|
|