FRF Limiting Function
Download PDF | © Copyright Crystal Instruments 2016, All Rights Reserved.
Introduction
When running a test to measure the FRF of a structure, or the Octave spectrum from a microphone channel, it may need to check the measured data against a pre-defined limit profile to see whether the measured signal has any point or portion over the limit. If this happens, the system is expected to give user the warning message of exceeding limit.
This can be done through the so called FRF Limiting Function. The limit can be set for literally any type of signals, not limited to the FRF signal alone. It can be time block, frequency spectrum, FRF, or Octave spectrum. The limit profile can be set in several different ways. Once the limit alarm function is enabled, and test is started, the test will run and the limit check will be carried out throughout the test running. Whenever the measured signal has point(s) over the limit profile, the alarm message of exceeding the limit will be broadcasted onto Run log window with detailed information.
Setup
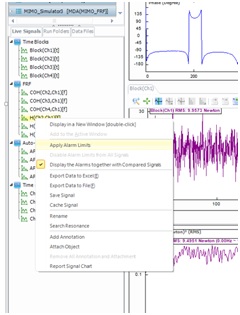
Once a test is created or opened, the test can be run once so that all the signals are acquired. From this point on, the limiting channel and profile can be set up. Right mouse click on any live signal will pop up a menu list, and “Apply Alarm Limits” can be selected.
The following screen allows the “add limit” operation,
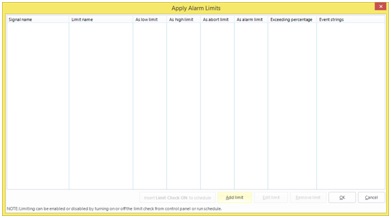
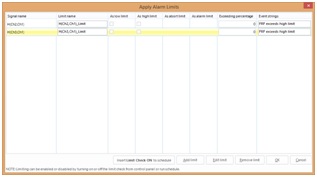
Upon clicking the “Add Limit” button, the “Add Limit” widow pops up and the desired signal can be checked to apply the limit on. For this case, FRF signal of H(Ch2, Ch1) is checked,

Upon clicking on “Ok”, the selected signal H(Ch2,Ch1) is added to the Apply Alarm Limits window. Either low or high limit, can be checked for the limit profile.

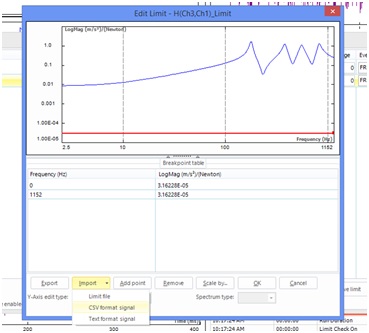
Now, the “Edit Limit” button can be clicked to bring up the Edit Limit window. Following Edit Limit window is shown with the measured H(Ch2,Ch1), the breakpoint table, and operation buttons.
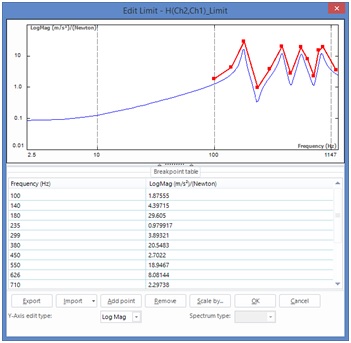
The limit profile can be simply constructed by adding the points of Frequency and value. For this purpose, the “Add point” and “Remove” buttons can be used. The frequency and magnitude values in the breakpoint table are set in the table, and they are editable. Note, for FRF type of limits, the magnitude will be checked.
The “Export” button allows the save of the limit profile to a file with the extension of “.lim”. “Import” allows the limit file (.lim file) to be browsed in from previous tests. Under “Import” button, import of CSV or TXT files are also available besides import of limit profile.
Following graph illustrates import of a CSV file selected and ready to be imported,

Click the “Ok” button, it brings in the following Edit Signal window.

The limit profile can be created by moving the mouse and inserting the point at cursor.
One great feature here is the “Envelope” function. Click the “Envelope” button, it brings up the following Envelope Settings window. With the definition of Frequency tolerance in Hz, and Magnitude tolerance in percentage, the Envelope of the imported file will be created and serves as the limit profile.

The following graph illustrates the limit profile which is the envelope over the imported FRF signal.

The max number of points for the limit profile is 100. In case the created envelope file has more points than 100, the “reduce points to” a defined number can be used. Select the desired number of points, i.e., 100, and click the “Apply” button. The algorithm will remove the in between points, and thus to keep the limit profile shape but with a smaller number of points.
On the Edit limit window, the “Scale by” button allows user to scale up or down the limit profile without re-entering the limit profile breakpoints. The Scale can be defined as a linear scale factor, or a log scale in dB.

Running the Test with Limiting Function
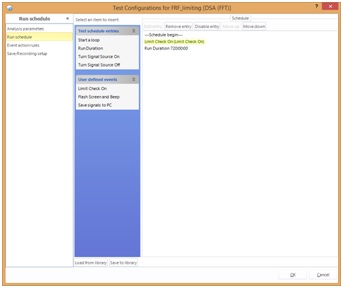
When a limit profile is built and saved, the “Limit check On” will be inserted to the Run Schedule upon user confirmation.
If the limit function needs to be disabled, right mouse click on any signal under the Live Signals, and select “Disable Alarm Limits from All Signals”.

This will stop the limit check, though all the limit profiles set up will be kept there. Check the low or high limit will enable the limit check again.
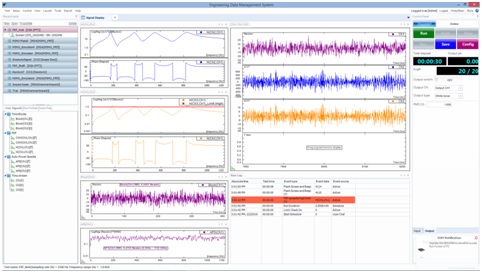
With the limiting function enabled, start the test, the limit check will be in force while the data is being acquired. And the status is updated in the Run log window. Following figure illustrates the test running, while the measured signal, H(Ch3,Ch1), is below the limiting profile.
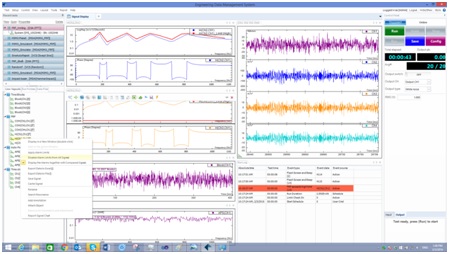
In case the measured signal exceeds the limit profile, the exceeding limit message will be added to the Run log window, with the number of occurrence.