Head Expander Modal Testing using Impact Hammer
Download PDF | © Crystal Instruments 2017, All Rights Reserved.
When testing large test articles along the vertical direction, the head expander is usually required. With the extended size of the head expander, larger test articles can be fixed on top of the head expander. The following photo illustrates a conventional head expander installed on top of a shaker table.

For any head expander, its natural frequencies are of high interest. Though FEA modal analysis can provide theoretical answers, it is practical to use experimental modal analysis to test and verify the modal parameters of the head expander.
With this note, the 32 inch square Head Expander manufactured by Sentek Dynamics is tested using the EDM Modal software from CI.
Head Expander Model
The top plate of the head expander is modeled with 25 measurement points, and the measurement is performed along the +Z (vertical) direction. The head expander is sitting on top of a few soft foams, thus the boundary condition is free-free.

The hammer impact test with roving response method is carried out, using an impact hammer and 2 uniaxial accelerometers. The fixed impact point is chosen at the point 8, +Z direction after the driving point selection process. The accelerometers are moved each time to take up the measurement of 2 points along their +Z direction.
FRF Measurement
The frequency span is set to 2.3 kHz, with a block size of 4096. With this setup, the response decays enough at the end of the block, and no windowing is required. In case of a very lightly damped structure, the response may not decay enough within the block length. For this case, the Force/Exponential window can be selected. This will force the response to decay and thus alleviate the leakage problem. In the meantime, the extra damping introduced by using this type of window needs to be corrected after the modal analysis process.

A linear average of 4 is used to obtain smooth signals. A higher number of averages results in a more accurate measurement of the spectrum, but it requires a corresponding increase in testing time.
Going through all 25 measurement DOFs, all FRF signals are measured and saved. The following examples are FRF signals in the format of Log Mag.

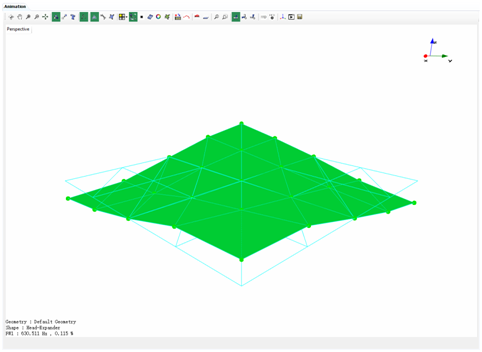
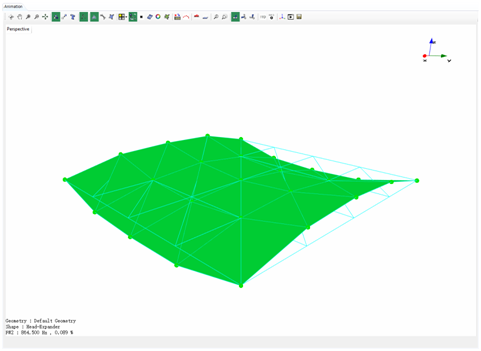
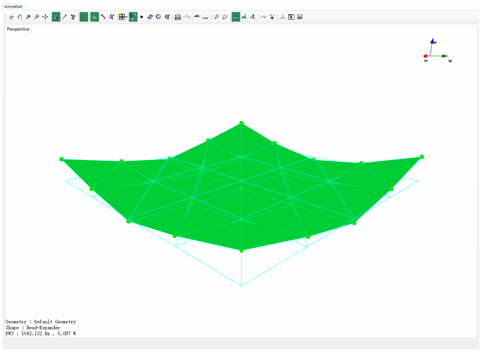
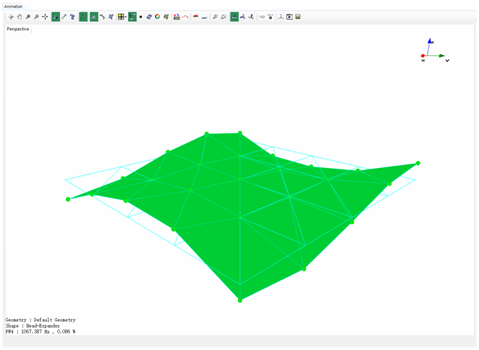
Modal Analysis Result
All the modes are identified using the EDM Modal Stability Diagram, the curve fitting method and the single reference LSCE method.

The first 4 modes are illustrated as following.