
Importance of Spectrum History Sine Signals in a Sine Test
Download PDF | Sandeep Mallela - Senior Product Manager | © Copyright Crystal Instruments 2018, All Rights Reserved.
Sine tests are performed on a variety of modes to test the DUT. In a Swept Sine test, the DUT is subject to a range of frequencies, one frequency at a time. The response obtained is filtered using a tracking filter centered on the frequency of interest.
Once a transfer function is obtained, it is easy to identify the resonance and anti-resonant frequencies of the DUT. For fatigue testing, a Sine test is typically run in a different mode known as a Dwell Sine where the DUT is subject to its resonant frequency until the DUT experiences fatigue. While the DUT is being driven at their resonant frequencies, the resonant frequency of the DUT tends to shift. Due to this phenomenon, yet another variation of Sine test, RTD (Resonance Track and Dwell) is used. In this mode, the resonance frequency of the DUT is continuously checked using the Amplitude or Phase of the response. Through mathematical calculations, a change in the resonant frequency along with the direction of change is determined. The drive output frequency is then modified instantaneously to drive the DUT at its resonant frequency at all times.
The fatigue testing can last anywhere from a few minutes to several hours. The instantaneous display of the time or frequency signals would be less useful under such test conditions and a synopsis of the entire test duration would be most helpful to draw testing conclusions on the DUT.
Crystal Instruments uses Spectrum history signals, a special type of signals plot to conveniently plot a user defined signal property vs. time or cycles on the X-axis. To ensure the best readability and analysis, the plot is enhanced to accommodate the entire test duration even when the test durations run into several days, weeks or months. With the PC memory as the limitation, test durations of several months or even years can be plotted and viewed simultaneously, thus eliminating any necessity to section the data plot.
Configuring Spectrum History Signals
Users are able to easily customize spectrum history signals by navigating to the “Measured Signals” section under “Setup Menu Items” and clicking on the “Spectrum History Signals” tab.
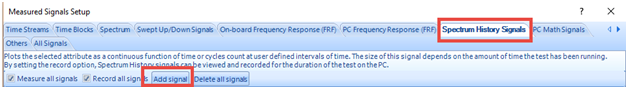
Customized signals are added by clicking on the “Add signal” button.
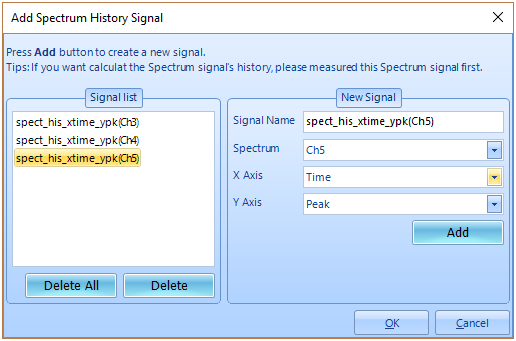
This gives a convenient interface to define and customize the channel, X-axis, and Y-axis measurement property.
The X-axis can be selected between Time and Cycles.
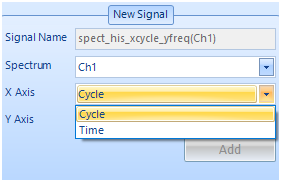
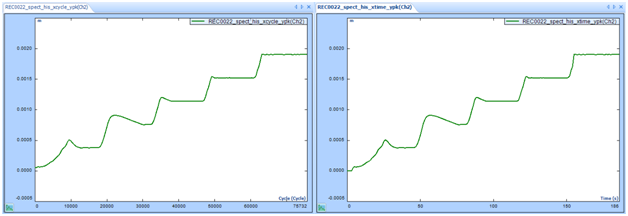
The number of cycles is an important factor when determining number of cycles the DUT can withstand before experiencing fatigue. EDM software makes it convenient to define any combination of X and Y axis with any given channel, which enables users to plot a signal attribute on both the Time and Cycles axis.
The Y-axis can be selected between Peak and Frequency.


The Frequency on the Y-axis plotted with Time / Cycles on the X-axis provides precise details on how long / how many cycles it has taken for the resonant frequency to shift. This also provides accurate details on how the resonant frequencies changed before the DUT encountered fatigue.