
EDM Modal Test Case | Modal Shaker Testing Using Different Excitations
Download PDF | by Ziyuan Jiao | Graduate Student, M.S.E ‘18 | University of Michigan, Ann Arbor, United States | © Crystal Instruments 2018, All Rights Reserved.
In modal testing, the hammer impact test is the simplest and the most cost-efficient way to acquire system frequency response functions (FRFs) from dynamical systems. Despite this, the hammer impact test has many limitations. The measurement data of a hammer impact test may not be as clean as expected, which may lead to inaccurate modal parameters. For complex structures, there may exist inaccessible points which cannot be measured or tested using an impact hammer. Also, many structures may have highly coupled modes at a similar frequency. For this case, multiple references are required to distinguish them. For less noisy and more accurate results, and for many industrial applications, modal shaker testing would be required to acquire system FRFs. The type of excitation signal used may influence the quality of the testing result and frequency response functions. In this test note, the modal shaker tests are conducted on an aluminum board and the comparison is made among three typical random excitation signals: white noise (pure random), burst random and pseudo random.
Aluminum Board Model
The aluminum board is modeled with 8 x 12 grids and it has 117 measurement points in total. (Figure (b)). The board is suspended from elastic bands which ensures a free-free boundary condition (Figure (a)). The modal shaker test with roving response method is used in this experiment.


Figure a. free-free suspension of aluminum board, Figure b. Geometry model of the aluminum board
The impedance head is mounted on No. 87 point (Figure below) to measure the +z (vertical) acceleration, which is connected to the modal shaker through the stinger. The modal shaker is placed on the floor and provides the excitation force laterally to the board. The three accelerometers measured node No.19, No.49, and No.70 for the frequency response function.

Figure c. Modal shaker and accelerometer measurement point
White Noise
White noise is a pure random signal which has constant power spectral density. It posesses equal intensity at all frequencies. The Hanning window must be applied to resolve the leakage issue inside each block. The frequency range of this test is set to 450 Hz, with a block size of 2048. At each test point, EDM Modal records measurement data from the linear mean of 16 frames of data. An increased number of frames could be selected to further attenuate the signal noise, at the cost of increasing the testing time.

The figure above shows the FRF and MIF results from white noise. Noise is significant at low frequency range (0~50Hz), while the results are not clean enough at high frequencies.
Burst Random
Burst random is a transient random excitation signal. For burst random excitation, no window is needed for the leakage issue if the response is fully decayed. The frequency range of this test is set to 450 Hz, with a block size of 4096. The duty cycle burst random excitation signal is set to 40%. With this setup, as shown in the following figure, a response signal from the accelerometer decays to zero approximately within the current block size. At each test point, EDM Modal records measurement data from the linear mean of 16 frames of data. An increased number of frames could be selected to further attenuate the signal noise, at the cost of increasing testing time.
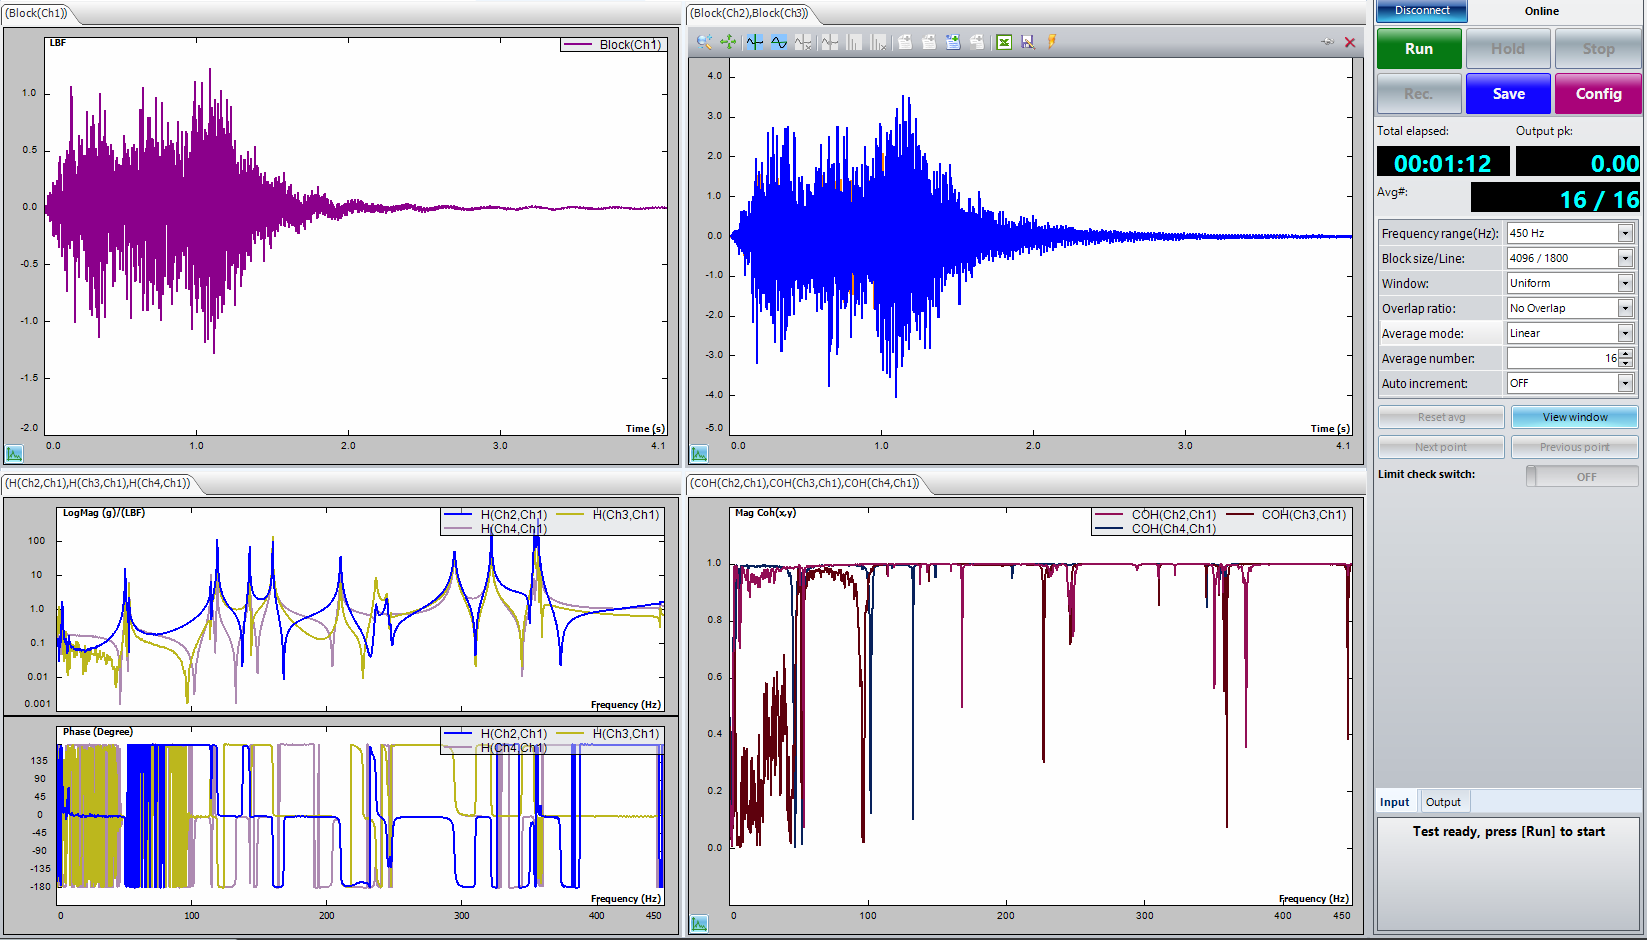
The figure above shows the FRF and MIF results from burst random. A higher noise level can be observed at a low frequency range (0~100Hz), and the results are less noisy at high frequencies. Without windowing, a longer block size is needed which results in a longer testing time.
Pseudo Random
Pseudo random is a periodic random excitation signal which has constant power spectral density only at integer multiples of the FFT frequency lines. Detailed information about pseudo random can be found in the following article: “Modal Shaker Testing Using Periodic Random Excitation” on the Crystal Instrument website. The frequency range of this test is set to 450 Hz, with a block size of 2048. No window is needed. Number of delay (Nd) is set to 4, which means the EDM software will wait for 4 blocks until the system reaches a steady state. Number of cyclic (Nc) is set to 3, which means the EDM software will use 3 blocks to calculate time average for one frame. At each test point, EDM Modal records measurement data from the linear mean of 16 frame data. An increased number of frames, number of delay and number of cycles could be selected to further attenuate the signal noise, at the cost of increasing testing time.
The following above shows the FRF and MIF results from pseudo random. The signal is much less noisy at a low frequency range (0~100Hz) than the other two above, while their noise levels are similar to each other. There is no doubt that pseudo random has the best measurement quality among all 3 kinds of excitation signals. However, the testing time is much more longer than the other two.

Summary
Generally speaking, all three excitation signals yield good results. Pure random has a moderate noise level and the shortest testing time. The Hanning window needs to be applied during the test. Burst random has a moderate noise level and moderate testing time because of a longer block size. No window is needed during the test. Pseudo random has the longest testing time but it produces the cleanest data. The user can choose a desired excitation signal based on their applications.