
Orbit Plot
The Orbit Plot display uses two data channels in the time domain. The signals from two channels are drawn on an X and Y plane to display the shaft position change versus the angle of rotation. Orbit displays give a two dimensional visual picture of the motion of a rotating shaft.
A well balanced shaft with no movement in any direction and would produce a dot in the middle of the plot. The shaft movement can give an indication of the vibration source e.g. if there is a lot of up/down movement it may be that the machine feet are not bolted down tightly enough.
To create an orbit plot you need to take a dual channel simultaneous measurement to capture data at the horizontal and vertical axes at the same time. The displacement or acceleration sensors must be placed 90° apart from each other.
The Orbit display uses a pair of measurements in the time domain. It does not require the technique of order tracking.

Figure 1. Construct an Orbit Plot
The Orbit display format is similar to Polar display, but it is constructed from 2 signals perpendicular to each other. Typically, it is associated with the current rotating speed of the shaft.
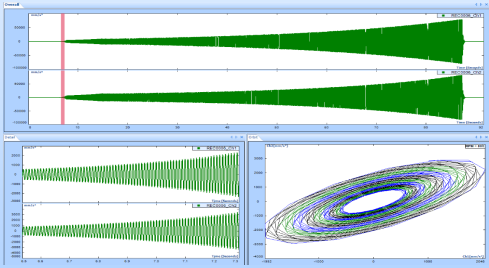
Figure 2. Orbit Plot with 2 signals