
Shutdown Protection System with Tracking Filters
Download PDF | by Simran Parmar - Application Engineer, Sandeep Mallela - Senior Product Manager, and James Zhuge, Ph.D. - Chief Executive Officer
© Copyright Crystal Instruments 2023, All Rights Reserved.
Introduction
Assessing the endurance of a device through shaker-induced vibration testing is a widely used technique, albeit one that can potentially damage the Device Under Test (DUT). Over-testing is of particular concern during vibration testing, potentially resulting in damage to the DUT from testing at amplitudes beyond the required driving frequency levels or high vibration levels in are produced in certain parts of the DUT. The risk of substantial damage is mitigated by closely monitoring all the responses from the DUT and implementing a threshold on the vibration level at that frequency. This allows a vibration controller to promptly halt its shaker if the threshold is surpassed and safeguards the DUT from any significant damage.
Vibration controllers offered today are equipped with limit checking on all channels that can either reduce the drive to ensure vibration levels stay within defined limits or the shaker amplifier system aborts when vibration levels exceed the defined threshold. However, depending on the excitation frequency, the vibration controllers can run for several cycles before the drive starts to ramp down or the shaker-amplifier assembly shuts down. Several cycles of excess vibration can render critical DUTs such as satellites and equipment for aerospace applications unsuitable for deployment. A simple solution is to deploy a secondary shutdown protection system that monitors the vibrations from all channels and sends a signal to the shaker-amplifier assembly to shut down within one cycle when thresholds are exceeded.
The Shutdown Protection System from Crystal Instruments is tailored to achieve this very objective. The SPS uses a single input channel (COLA channel) to measure and track the driving frequency and subsequently implements a bandpass filter with a center frequency that matches the driving frequency to all measurement channels. The resulting amplitudes are compared against user defined thresholds and abort signals are sent through digital outputs to shut down the shaker-amplifier assembly.
Crystal Instruments incorporates a wide range of options tailored to the specific needs of an application by considering the maximum allowable time between the detection of threshold exceedance to the generation of a digital output. A shutdown signal can be generated within 10 milliseconds from the time a threshold has exceeded user defined limits.
The various implemented techniques along with their merits and reaction times are discussed in this paper.
Brief Overview of the Shutdown Protection System
CI Spider systems featuring a digital input and output (DIO) interface along with EDM VCS software compatibility can run as a shutdown protection system. The main purpose of this function is to act as an independent hardware system to protect the shaker system. It can send out a shutdown digital output signal in less than 10 milliseconds based on various signal trigger conditions. It also includes various tracking filters that are identically implemented in the Sine controller.

When tracking filters are enabled in the SPS, which is common when a Sine test is conducted on a shaker, a COLA signal from the vibration controller is fed into the shutdown system. The SPS detects the sweeping frequency of the vibration controller which is then used in the tracking filters.
If the trigger condition is applied to the output of the tracking filter values, the reaction time varies depending on the setups of filter parameters. Crystal Instruments provides one of the best tracking filter implementations in the world.
The performance matrix includes following aspects of the SPS:
SPS reaction time
Amplitude accuracy of the tracking filter output
Attenuation to the harmonics
Frequency response of tracking filters: FRF of filter provides more detailed descriptions of the filter in the frequency domain.
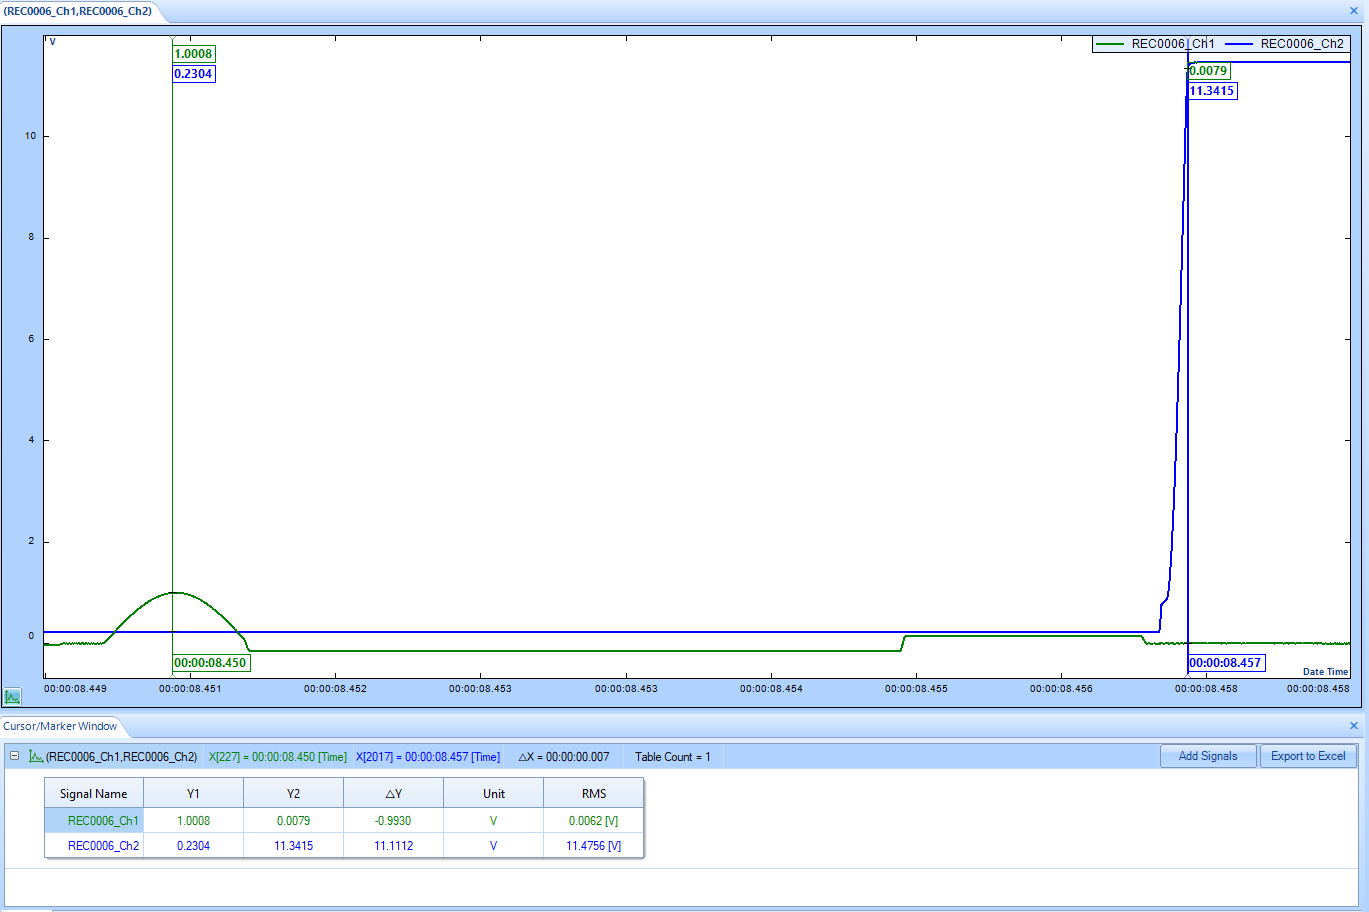
Reaction Time
This paper defines the reaction time as the time interval between the first unfiltered time sample which exceeds the threshold to the time a digital output is triggered. The digital output is configured to rise from 0 to 1 when triggered for comparison.
The rise time of the digital output was measured as approximately 250 μs, which is a comparatively less significant contributing factor to the reaction time measurements presented in this paper.
For simplicity in presenting the results, the reaction time presented in this paper includes the rise time of the digital output.
Shutdown Protection using unfiltered time data
Every DUT presents unique challenges and requirements to process time domain data and shut down a shaker when vibrations of excess amplitudes are detected by sensors on the DUT.
One approach for applications where the maximum amplitude in Acceleration or Displacement is a cause of concern uses time data acquired from sensors to detect if a threshold is exceeded and sends a digital output signal. This approach is typically useful in scenarios where the harmonics of the driving frequency potentially causes the overall vibration amplitudes to exceed acceptable limits. These scenarios require the shaker to shut down as soon as possible to avoid any undesired effects to the DUT.
Users can configure the CI Shutdown Protection System to monitor time domain waveforms and perform comparisons with the threshold on each input time waveform sample received by the instrument. This configuration ensures the fastest way to send an abort signal to the shaker system.
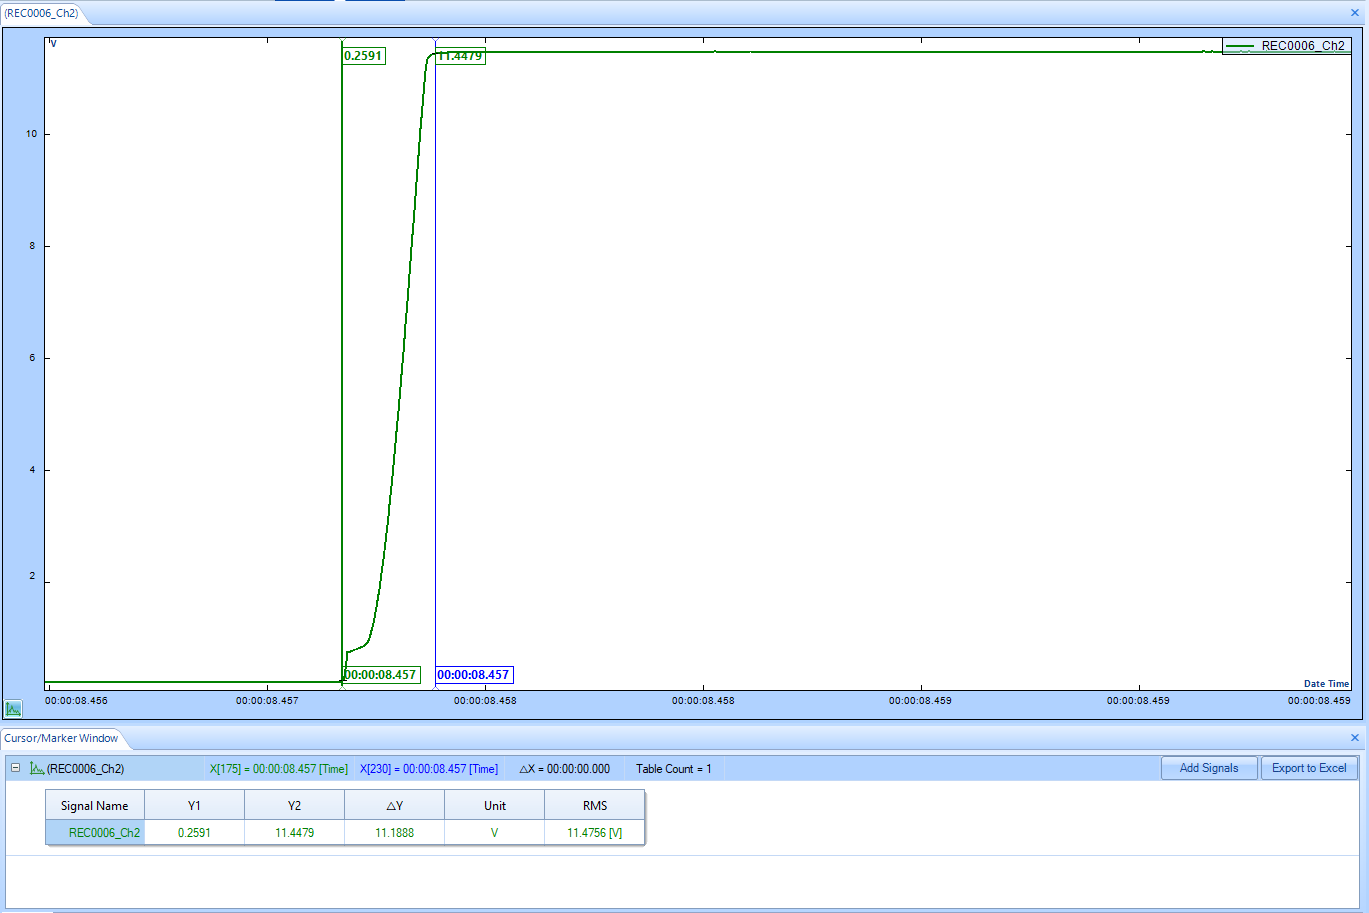
Reaction time using unfiltered time data
The reaction time between the first time-domain data sample exceeding the threshold to the time of sending the digital output was determined to be about 7 ms using this approach for the shutdown system.
Advantages of using unfiltered time data
The reaction time is extremely quick and is less than 10 ms for any channel.
This approach is extremely advantageous when the overall vibration or the vibration peak needs to be limited.
Another major advantage of CI’s approach is the use of unfiltered time data limits in conjunction with filtered time or frequency limits. This approach enables the unfiltered time data limits to act as a secondary protection level for the shutdown protection system.
Shutdown protection using filtered time data
Applications involving a comparison of amplitudes for only the driving frequency require a tracking filter to filter all other frequencies around the driving frequency.
Various measurement types and filter strategies are developed by Crystal Instruments to address specific test requirements. Proportional filters have excellent attenuation at harmonic frequencies while having a very short reaction time to the fixed band IIR filters that operate using a very narrow band across the frequency spectrum. The fixed band + proportional filter combines the best qualities of both filters deployed and presented in this section.
The filter shape, accuracy of amplitude measurements, magnitude of harmonic rejection, and the reaction time at various driving frequencies for each type have been presented.
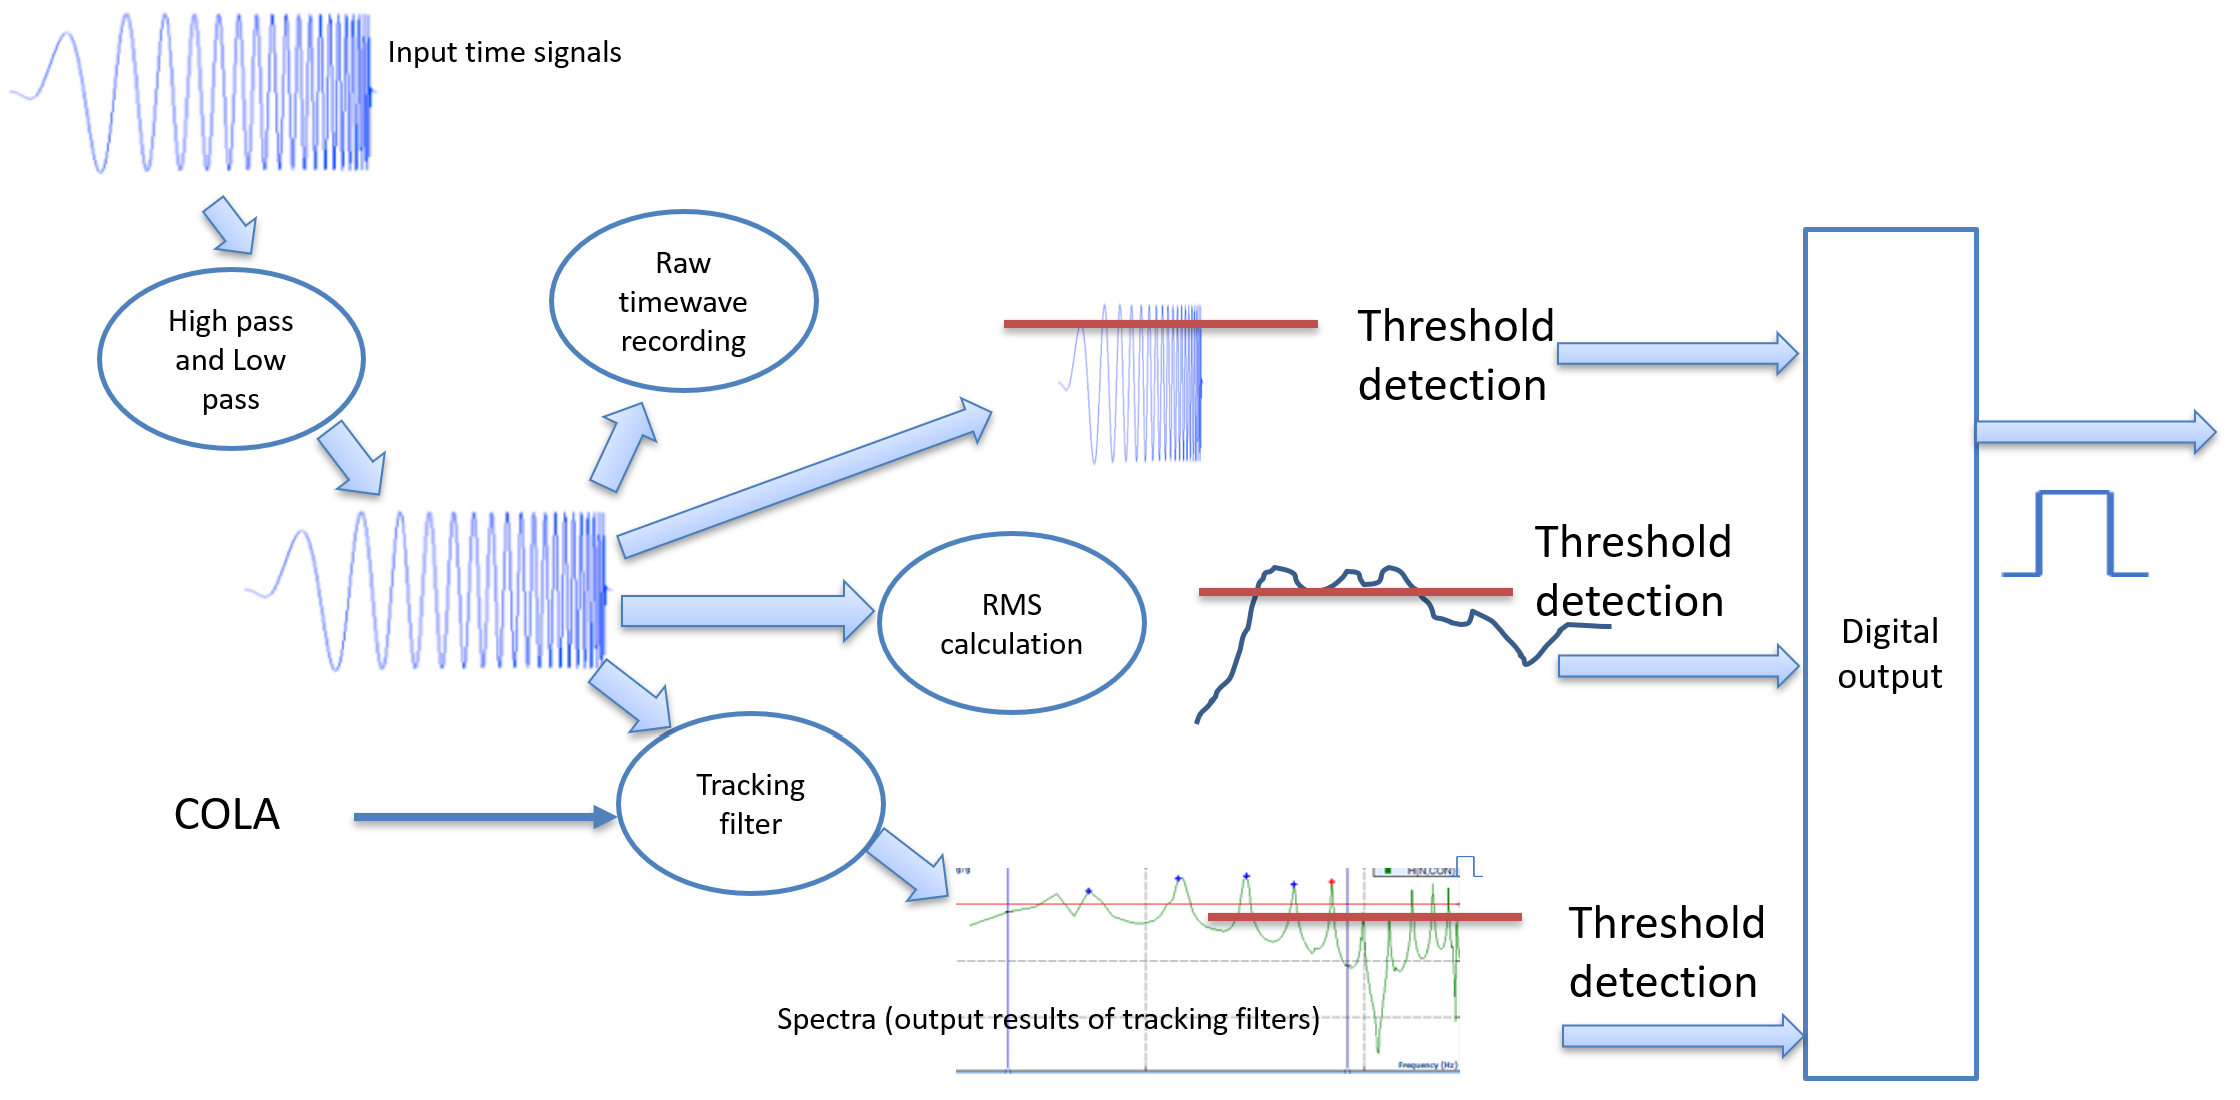
Measurement Strategies on Shutdown Protection System
To begin with, a brief description of the measurement strategies is discussed. A ‘Spectrum’ signal is continuously generated in real-time for each enabled monitor channel in the VCS Shutdown system. The magnitude of the signal is dependent on the measurement strategy used, which are described below.
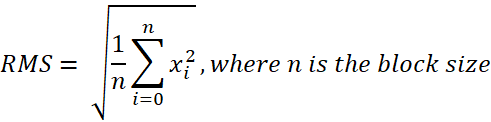
RMS
The spectrum will display the root-mean square (RMS) value of an incoming time block according to the following equation:
Peak
The spectrum will display the peak value seen for an incoming time block.

Mean
The spectrum will display the mean value of an incoming time block according to the following equation.
Filter
An incoming time data will first traverse through a designated bandpass tracking filter.
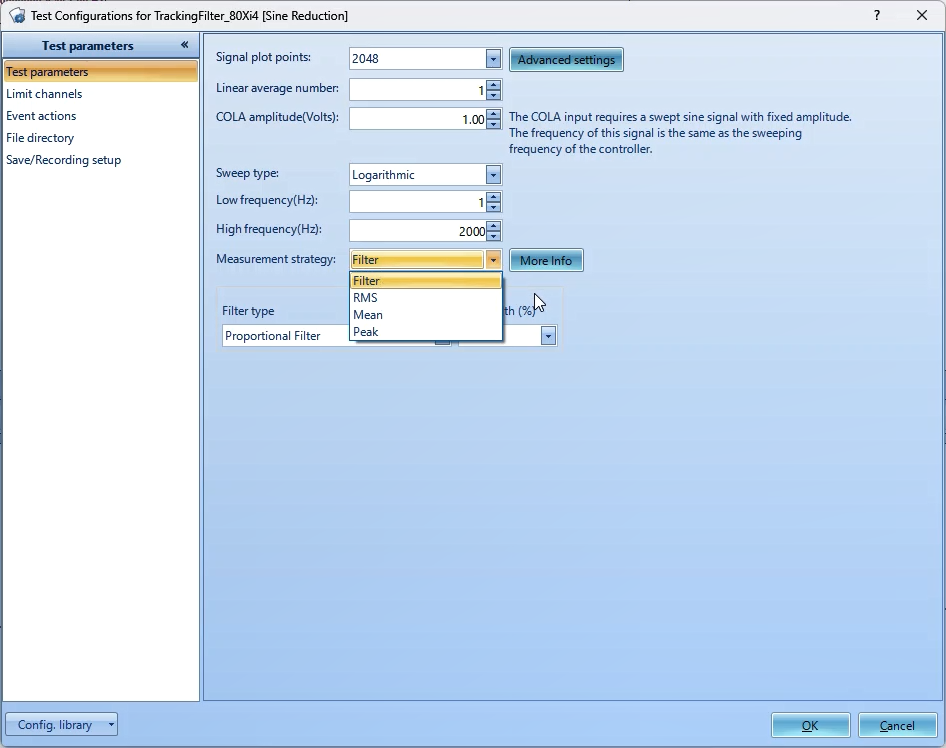
Figure 1. Configuration settings for the VCS Shutdown system
Users can select one of the following filters.
Proportional Tracking Filter - Bandwidth is proportional to the tracking frequency. Choice of 100%, 50%, 25%, 12.5%, 6.25% are available for the proportional tracking filter selection.
Fixed Bandwidth (IIR) Tracking Filter - An infinite impulse response fixed bandwidth filter. A choice of 2nd order or a 4th order filter is available.
Proportional + Fixed Bandwidth (IIR) Tracking Filter - A proportional filter cascaded with an infinite impulse response fixed bandwidth filter. Various options are available in the Proportional and Fixed bandwidth filter.
The flexible filter choices allow users to select one based on their application needs. The subsequent sections provide more in-depth information for each filter’s performance characteristics and offers guidelines to help users select the most appropriate filter.
Proportional Filter
The bandwidth of the Proportional Tracking Filter is proportional to the driving frequency. It is the fastest filter at any frequency range and has operational capabilities down to drive frequencies of 1 Hz with minimal delays. It also has the advantage of performing extremely well for a wide range of frequencies, from 1 Hz to 20 kHz or even higher.
Another major advantage of the Proportional Filter its very high attenuation at harmonic frequencies. Considering that the harmonic frequencies are the most dominant frequencies during Sine vibration testing on a shaker, the Proportional Filter is the most ideal filter type to yield quick and accurate results.
Users can select 100%, 50%, 25%, 12.5% or 6.25% for the bandwidth of the Proportional Filter.
At 100% bandwidth, the bandwidth of the Proportional Filter is 100 Hz when the driving frequency is 100 Hz and similarly the bandwidth is 25 Hz at a driving frequency of 100 Hz when the bandwidth of the proportional filter is selected as 25%.
Filter Shapes of Proportional Filter
The following figures show the Proportional Filter shapes at different selections of bandwidths and different driving frequencies.
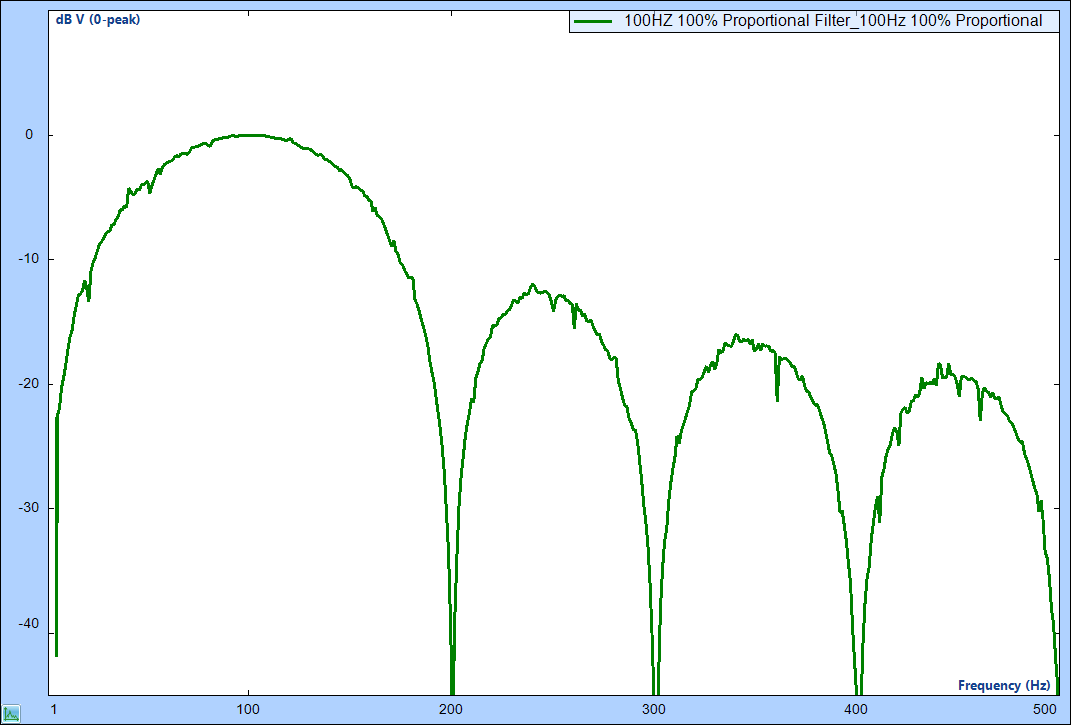
Figure 2. Frequency response of the 100% Proportional Filter with a center frequency of 100 Hz

Figure 3. Frequency response of the 100% Proportional Filter with a center frequency of 10 Hz

Figure 4. Frequency response of the 25% Proportional Filter with a center frequency of 10 Hz
Users can observe that the Proportional Filter has extremely good attenuation at the harmonic frequencies of the driving frequency.
Amplitude Accuracy and Harmonic Attenuation of Proportional Filter
The table below shows the amplitude accuracy of the driving frequency and the amplitude attenuation of the 2nd and 3rd harmonics. These tests have a 1 V amplitude driving frequency signal while 2nd harmonic and 3rd harmonic frequencies are fed to the measurement channel as the COLA frequency is kept constant.
Amplitude accuracies are also measured when two-tone signals consisting of the driving frequency with the 2nd or 3rd harmonic is fed to the measurement input channel of the instrument.
Ideally, a value of 0 dB will result for the measurement channels which are fed with the amplitude of 1st harmonic (driving frequency), driving frequency with 2nd harmonic, and the driving frequency with 3rd harmonic, while amplitudes close to the noise floor are expected for measurement channels fed with 2nd harmonic and 3rd harmonic signals.
| Driving Frequency | Amplitude of 1st Harmonic (Driving Frequency) | Amplitude of 2nd Harmonic | Amplitude of 3rd Harmonic | Amplitude of 2-tone signal (1st + 2nd Harmonic) | Amplitude of 2-tone signal (1st + 3rd Harmonic) |
|---|---|---|---|---|---|
| 10 Hz | -0.03 dB | -99.5 dB | -99.0 dB | -0.01 dB | -0.01 dB |
| 20 Hz | -0.02 dB | -100.7 dB | -98.1 dB | -0.01 dB | -0.01 dB |
| 50 Hz | -0.04 dB | -90.1 dB | -90.1 dB | -0.02 dB | -0.001 dB |
| 100 Hz | -0.02 dB | -94.7 dB | -94.5 dB | -0.0045 dB | -0.0067 dB |
Table 1. Amplitude Accuracy and Harmonic Attenuation using a 100% Proportional Filter
Users can observe the performance of the Proportional Filter is close to perfect in terms of amplitude accuracy and rejection of harmonics.
Reaction Time of Proportional Filter
The reaction time was measured by feeding a high amplitude square wave input to the measurement channels and a time between the edge of the square wave to the edge of the digital output was measured.

Figure 5. Time delay between when a square wave with a 100 Hz frequency exceeded a frequency-based limit (green cursor) and when the Spider-80Xi’s digital output was triggered (blue cursor).
The results are the same even when a Sine wave input is used. The table below shows the reaction time for a Proportional Filter with a bandwidth of 100%.
| Driving Frequency | Reaction Time |
|---|---|
| 10 Hz | 63 ms |
| 20 Hz | 34 ms |
| 50 Hz | 18 ms |
| 100 Hz | 12 ms |
Table 2. Reaction time using a 100% Proportional Filter
The reaction time of the Proportional Filter is approximately half a cycle, which is considered as extremely fast in comparison to other FIR or IIR filters (which take 1 to several cycles to stabilize).
Advantages of Proportional Filter
The Proportional Filter has a major advantage in terms of reaction time based on various results. The reaction time is about half a cycle for low frequencies and approximately 10 ms for frequencies 100 Hz or higher. Combined with high attenuation at harmonic frequencies, this is the most ideal filter type for a majority of applications.
Shortcomings of Proportional Filter
Although the Proportional Filter is useful in a majority of scenarios, it does fall short when there are several resonant frequencies to a structure. As the frequency increases, the bandwidth of the proportional filter increases, allowing the resonant frequencies to within the bandwidth to pass through and potentially cause false alarms.
A Fixed Band IIR Filter or a Fixed Band IIR Filter + Proportional Filter addresses these shortcomings.
Fixed Bandwidth IIR Filter
A Fixed Bandwidth IIR Filter is implemented using the IIR Filter. Options for the selection of a 2nd order or 4th order IIR Filter is available along with the selection of bandwidth.
The primary advantage of a Fixed Bandwidth IIR Filter is that the bandwidth is constant at all frequencies. If resonant frequencies of the DUT is a major concern, it is ideal to use the Fixed Band IIR Filter instead of the Proportional Filter because a smaller bandwidth at high frequencies can significantly attenuate the response due to resonant frequencies.
A 2nd order IIR Filter has a gradual roll-off in the stop band while having a shorter reaction time. On the other hand, the 4th order IIR Filter has a sharper roll-off while having a longer reaction time. The availability of 2nd order and 4th order filters allows users to select a filter based on the desired roll-off versus desired reaction time. As in the case of any IIR Filters, the reaction time is inversely proportional to the bandwidth of the filter.
Filter shapes of Fixed Band IIR Filter
The figures below show the filter shapes for 2nd order and 4th order Fixed Band IIR Filters with a 10 Hz bandwidth.
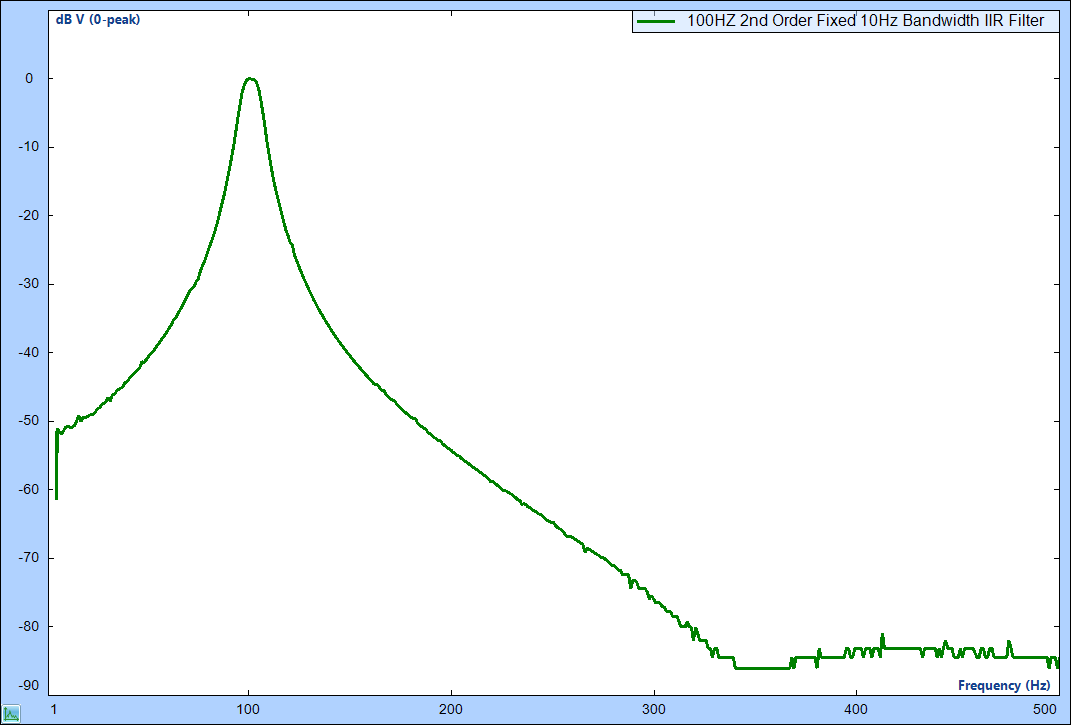
Figure 6. Frequency response of the 2nd order 10 Hz fixed bandwidth IIR Filter with a center frequency of 100 Hz

Figure 7. Frequency response of the 2nd order 10 Hz fixed bandwidth IIR Filter with a center frequency of 10 Hz

Figure 8. Frequency response of the 4th order 10 Hz Fixed Bandwidth IIR Filter with a center frequency of 100 Hz
Figure 9. Frequency response of the 4th order 10 Hz Fixed Bandwidth IIR Filter with a center frequency of 10 Hz
Users can observe that the Fixed Band IIR Filter has extremely good attenuation in the stop band. The 4th order IIR Filter has very sharp roll-offs and a very high attenuation for frequencies just out of the pass band.
Amplitude Accuracy and Harmonic Attenuation of Fixed Band IIR Filter
The tables below show the amplitude accuracy of the Fixed Band IIR Filter. The testing procedure is the same as the testing procedure used for calculating the amplitude accuracy and the harmonic attenuation of the Proportional Filter.
| Driving Frequency | Amplitude of 1st Harmonic (Driving Frequency) | Amplitude of 2nd Harmonic | Amplitude of 3rd Harmonic | Amplitude of 2-tone signal (1st +2nd Harmonic) | Amplitude of 2-tone signal (1st +3rd Harmonic) |
|---|---|---|---|---|---|
| 10 Hz | -0.05 dB | -12.09 dB | -22.81 dB | 0.40 dB | -0.0013 dB |
| 20 Hz | -0.04 dB | -23.92 dB | -35.85 dB | -0.0034 dB | 0.06 dB |
| 50 Hz | -0.01 dB | -40.48 dB | -54.40 dB | 0.01 dB | -0.0073 dB |
| 100 Hz | -0.0081 dB | -54.44 dB | -76.89 dB | -0.0085 dB | -0.0035 dB |
Table 3. Amplitude Accuracy and Harmonic Attenuation using a 2nd order 10 Hz Fixed Bandwidth IIR Filter
It can be observed that the amplitude accuracy is extremely good for the 2nd order filter. The harmonic attenuation is very good for the high frequencies, but as we approach low frequencies, the harmonic frequency is very close to the pass band of the filter and thus the attenuation is minimal. If we move even closer to 1 Hz, the harmonic attenuation would be negligible since the harmonics would lie within the passband.
Reaction Time of Fixed band IIR Filter
Similar to the measurement of reaction time for the Proportional Filter, the reaction time was measured by feeding a high amplitude square wave input to the measurement channels and a time between the edge of the square wave to the edge of the digital output.
The results are the same even when a Sine wave input is used. The table below shows the reaction time with a 2nd order 10 Hz Fixed Bandwidth IIR Filter.
| Driving Frequency | Reaction Time |
|---|---|
| 10 Hz | 79 ms |
| 20 Hz | 78 ms |
| 50 Hz | 82 ms |
| 100 Hz | 83 ms |
Table 4. Reaction Time using a 2nd Order IIR 10 Hz Fixed Bandwidth Filter
| Driving Frequency | Reaction Time |
|---|---|
| 10 Hz | 129 ms |
| 20 Hz | 123 ms |
| 50 Hz | 129 ms |
| 100 Hz | 128 ms |
Table 5: Reaction Time using a 4th Order IIR 10 Hz Fixed Bandwidth Filter
Users can observe that the reaction time of the Fixed Band IIR Filter is almost constant for any driving frequency with the 2nd order filter having a shorter delay than the 4th order filter.
The 2nd order filter with a reaction time of under 100 ms is the most suitable selection when the Fixed Band IIR Filter should be used.
Advantages of Fixed Band IIR Filter
The Fixed Band IIR Filter is useful when the bandwidth of the filter needs to be constant throughout the entire frequency range. This is helpful when resonant frequencies are present at different points within the structure need to be filtered out.
Additionally, the filter delay time with 10 Hz bandwidth is about 80 ms for the 2nd order filter, which is still significantly low for a shutdown protection system.
Shortcomings of Fixed Band IIR Filter
A major disadvantage of the Fixed Band IIR Filter is its inability to attenuate the harmonics at low frequencies. Due to the fixed bandwidth nature of the filter, the harmonics are within the pass band of the filter at low frequencies such as 1 Hz.
Reducing the filter’s bandwidth to accommodate the low frequencies will significantly increase the reaction time which makes it less suitable as a shutdown protection system.
Fixed Bandwidth IIR + Proportional Filter
Although the Proportional Filter addresses a majority of applications, it may not be effective for some critical applications. The downsides of the Fixed Band IIR Filter, especially for low frequency performance, makes it a less than ideal choice when the operational frequency is 10 Hz or lower.
To address these applications, Crystal Instruments designed a proprietary filter that combines the best characteristics of the Proportional and Fixed Band IIR Filter in addition to providing a quick shutdown signal.
The Fixed Bandwidth + Proportional Filter is designed so that the harmonics attenuates significantly while keeping a fixed bandwidth. Thus, the filter is extremely effective even down to 1 Hz in effectively eliminating the harmonics while keeping a fixed band at high frequencies. The reaction time is within milliseconds which makes it ideal for all applications.
The customizable parameters include the order of the IIR Filter and the proportional bandwidth of the Proportional Filter.
Filter shapes of Fixed Band IIR + Proportional Filter
The following figures show the filter shapes for various configurations of the Proportional Filter at driving frequencies of 10 Hz and 100 Hz.
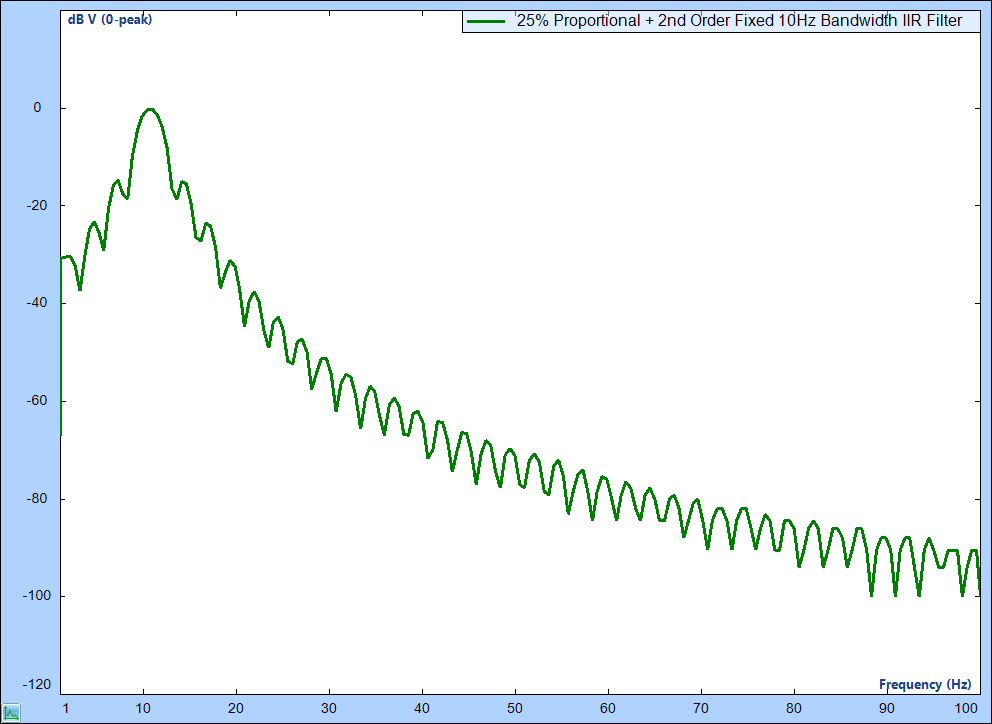
Figure 10. Frequency response of the 25% Proportional + 2nd order 10 Hz Fixed Bandwidth IIR Filter with a center frequency of 10 Hz

Figure 11. Frequency response of the 100% Proportional + 2nd order 10 Hz Fixed Bandwidth IIR Filter with a center frequency of 100 Hz

Figure 12. Frequency response of the 100% Proportional + 4th order 10 Hz Fixed Bandwidth IIR Filter with a center frequency of 100 Hz

Figure 13. Frequency response of the 100% Proportional + 2nd order 10 Hz Fixed Bandwidth IIR Filter with a center frequency of 10 Hz
Users can observe that the filter preserves high attenuation at harmonic frequencies while keeping a fixed bandwidth at high frequencies.
Amplitude Accuracy and Harmonic Attenuation of Fixed band IIR + Proportional Filter
The tables below show the amplitude accuracy of the Fixed Band IIR + Proportional Filter. The testing procedure is identical to the procedure used for calculating the amplitude accuracy and the harmonic attenuation of the Proportional Filter.
| Frequency | Amplitude of 1st Harmonic (Driving Frequency) | Amplitude of 2nd Harmonic | Amplitude of 3rd Harmonic | Amplitude of 2-tone signal (1st + 2nd Harmonic) | Amplitude of 2-tone signal (1st + 3rd Harmonic) |
|---|---|---|---|---|---|
| 10 Hz | -0.02 dB | -91.13 dB | -95.97 dB | -0.0034 dB | -0.0041 dB |
| 20 Hz | -0.02 dB | -95.71 dB | -98.36 dB | -0.0032 dB | -0.0014 dB |
| 50 Hz | -0.02 dB | -98.66 dB | -100.23 dB | -0.0069 dB | -0.0036 dB |
| 100 Hz | -0.01 dB | -99.37 dB | -102.29 dB | -0.0025 dB | -0.001 dB |
Table 6. Amplitude Accuracy and Harmonic Attenuation using a 100% Proportional + 2nd Order 10Hz Fixed Bandwidth IIR Filter
Users can observe the amplitude accuracy is extremely good along with an excellent harmonic attenuation for the 100% bandwidth Proportional Filter with a 2nd order IIR Filter. The results are effective even at the low frequencies, making it ideal for any application or scenario.
Reaction Time of Fixed Band IIR + Proportional Filter
Similar to the measurement of reaction time for the Proportional Filter, the reaction time was measured by feeding a high amplitude Sine wave input to the measurement channels and a time between the edge of the square wave to the edge of the digital output.
The results are the same even when a Sine wave input is used. The table below shows the reaction times of a Proportional Filter with bandwidth of 100%.
| Driving Frequency | Reaction Time |
|---|---|
| 10 Hz | 142 ms |
| 20 Hz | 104 ms |
| 50 Hz | 92 ms |
| 100 Hz | 86 ms |
Table 7: Reaction time using a 100% Proportional + 2nd order IIR 10 Hz Fixed Bandwidth Filter
Users can observe that the reaction time at higher frequencies is about the same as the Fixed Band IIR Filter at the low frequencies, but slightly longer than the Fixed Band IIR Filter.
The slightly higher filter delay time is expected considering the better attenuation of the harmonics at the low frequencies.
Thus, the Fixed Bandwidth IIR + Proportional Filter resolves the Fixed Band IIR Filter issues by working effectively down to 1 Hz without increasing the reaction time at high frequencies.
Advantages of Fixed Band IIR + Proportional Filter
The Fixed Band IIR + Proportional Filter is ideal for any application with a sweep range down to low frequencies such as 1 Hz and a narrow passband is required at high frequencies.
If a Fixed Band IIR Filter is used, the bandwidth selection must be very small which makes the reaction time a matter of seconds. However, in the case of a Fixed Band IIR + Proportional Filter, the reaction time is very small and requires milliseconds even for very low driving frequencies while the reaction time is the same as the Fixed Band IIR Filter at high frequencies.
Thus, the Fixed Bandwidth + Proportional Filter works effectively where traditional analog tracking filters fail to work.
Shortcomings of Fixed Band IIR + Proportional Filter
The disadvantage of the Fixed Band IIR + Proportional Filter is a longer delay time than the Proportional Filter.
However, considering the advantages of this filter where the bandwidth needs to be fixed at all frequencies, this is the most ideal filter in scenarios where a fixed narrow band is required for high frequencies.
Which Filter Should be Used?
The selection of a suitable filter is contingent upon the specific application of the user. As detailed in the preceding sections, each filter exhibits distinct benefits and limitations with regards to parameters such as amplitude precision, harmonic suppression, and reaction time.
The images below show the shapes of various filters presented in this paper with 10 Hz and 100 Hz as the driving frequencies.
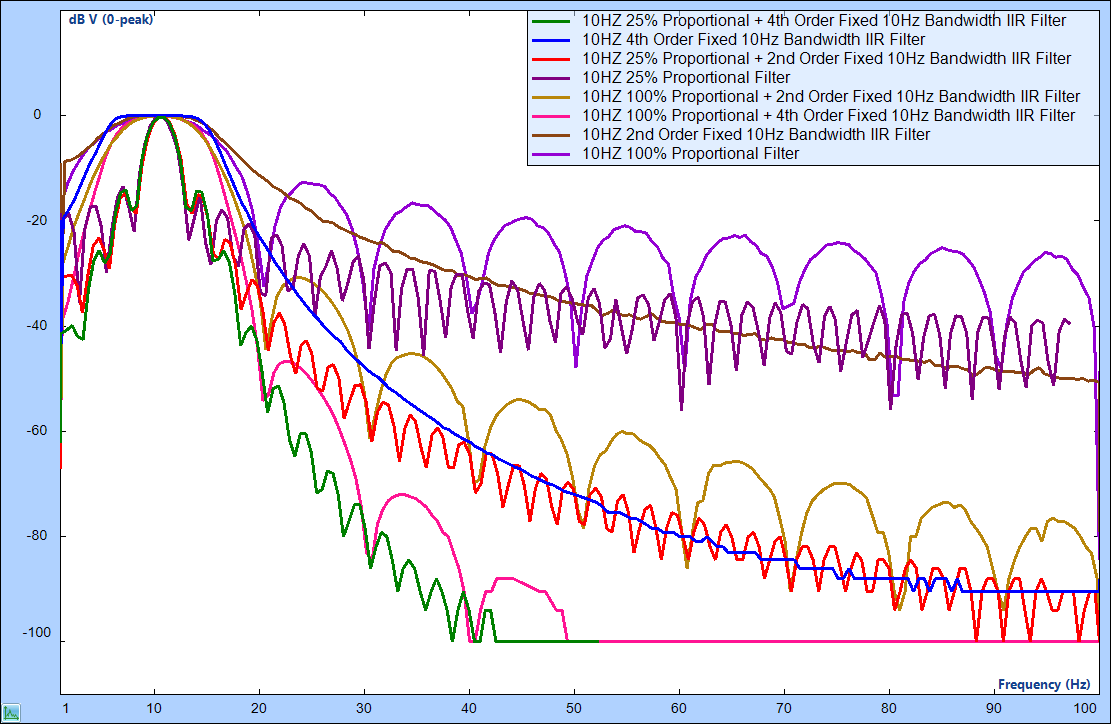
Figure 14. Frequency Response of various filters with a center frequency of 10 Hz

Figure 15. Frequency Response of various filters with a center frequency of 100 Hz
To facilitate an informed filter choice, the table below provides a general guideline for an appropriate filter selection.
| Filter Type | Reaction Time | Harmonic Attenuation | Bandwidth |
|---|---|---|---|
| Proportional | Excellent | Excellent | Excellent at low frequencies, Acceptable at high frequencies |
| Fixed Bandwidth IIR | Good | Not ideal at low frequencies | Not ideal at low frequencies, Excellent at high frequencies |
| Proportional + Fixed Bandwidth IIR | Good | Excellent | Excellent |
Table 8: Filter performance comparison
As previously noted, the provided table serves as a general guideline. However, VCS Shutdown System users have the flexibility to modify filter parameters according to their needs. For instance, when using a Proportional Filter, the bandwidth ratio can be adjusted to 6.25%, 12.5%, 25%, 50%, or 100%. On the other hand, users can implement a 2nd or 4th filter and set the bandwidth between 1 Hz and 46 kHz for a Fixed Bandwidth IIR Filter. Moreover, in cases where both Proportional and Fixed filters are cascaded, users can select any combination of the aforementioned parameters to meet their specific requirements.
Conclusion
In conclusion, assessing the endurance of a device through shaker-induced vibration is a widely used technique that poses potential damage to the Device Under Test. The implementation a secondary shutdown protection system is crucial to mitigate the risk of substantial damage.
The Proportional Filter is the preferred method of implementation due to its very short reaction times.
In scenarios where a narrow band is required at frequencies higher than 100 Hz while operating effectively at 10 Hz or lower, the Crystal Instruments’ Fixed Band + Proportional Filter provides optimal functionality as a shutdown protection system.