
Sine - Resonance Search Dwell and Tracking (RSTD)
Download PDF | © Copyright Crystal Instruments 2016, All Rights Reserved.This product note demonstrates the use of Crystal Instruments’ Spider 80X along with EDM (Engineering Data Management) software to determine the resonant frequency of a test object with a very high Q and dwell on the resonant frequency along with tracking the changes in the resonant frequency using the phase value.
Quality Factor is a dimensionless quantity typically denoted as Q-Factor and indicates energy loses within the structure. The Q indicates energy loss relative to the amount of energy stored within the system. Higher the Q of a structure, the lower is the rate of energy loss. Hence, it would take more cycles / oscillations to come to rest than an object with low Q. The frequency of these oscillations is called its resonant frequency.
Q factor for mechanical structures is measured as a ratio of resonant frequency fc to the bandwidth (defined using the half power frequencies (also known as the -3dB frequencies) f1 and f2). As the Q of the structure increases, the following becomes narrower and sharper.
At resonant frequencies, small periodic driving forces have the ability to produce large amplitude oscillations. This is because the system stores vibrational energy.When these structures are subject to their resonant frequencies, they tend to fatigue sooner, due to the energy stored. This property of the materials is used to determine the minimum life of the structures being tested.
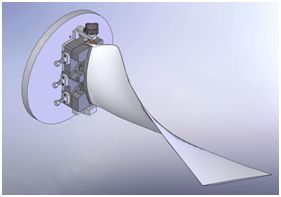
Turbine blades used in the Jet engines, among others (typically have very High Q-factor) are subject to their resonant frequencies as they rotate. Due to the vital role of the turbine blades in the operation of most machinery, engines and aircrafts, it becomes extremely important to determine the minimum duration or the minimum life of these objects before they get fatigue leading to the failure of the turbine.

The shortest life of these structures would be when the structures are continuously subject to their resonant frequencies. During continuous operation and changes in temperature, the resonance frequency of these structures tends to drift. Therefore, it becomes important that the driving frequency is intelligently modified such that the structure is always subject to its resonant frequency even during the changes in the resonant frequency.
Test Objectives:
The target of these tests is to determine the number of cycles it takes for the test object to fatigue when it is subjected to vibrations at its resonance frequency. To achieve this, resonant frequency of the test object is initially found and the shaker with the test object is driven at this frequency until it fatigues.
During the course of this test, the resonant frequency of the test object typically changes while the phase at the resonance is constant. This property of the physical materials is used to quickly track the resonant frequency changes and it is ensured that the test object is always subject to vibrations at its resonant frequency.
Tests for this Crystal Instruments’ algorithm has been conducted on a turbine blade with a small weight attached to it tip (typically the Shroud) and the object has a Quality (Q) factor of over 2000.

Test Conditions:
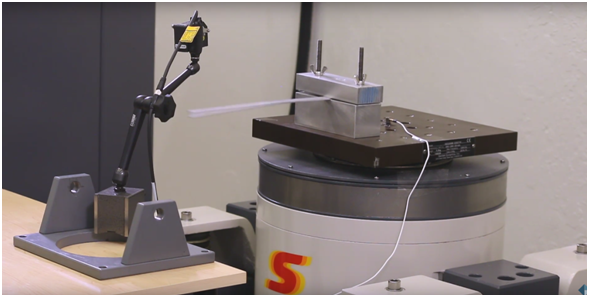
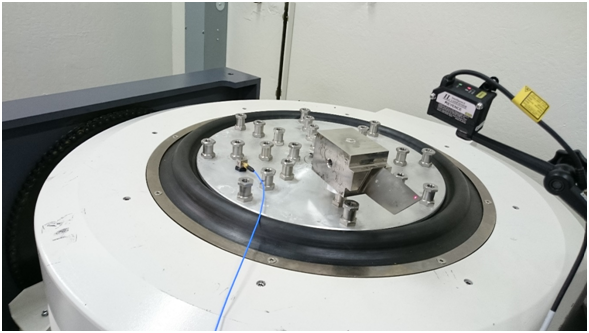
The turbine blade with a weight at its tip is attached to the shaker head. The vibrations on the shaker head is monitored using an accelerometer. A laser displacement sensor is mounted and focused on to the tip of the vibrating beam to accurately measure the displacement on the beam.
Channel 2 is used for measuring Displacement and Channel 1 is used for measuring Acceleration.
Channel 2 (Displacement) has been used as control throughout the test to ensure that excess displacements on the beam are avoided.
Initial Test:
A low level random test for a very short time was initially run to determine the resonant frequency of the test object. A low level test ensures that the beam is not subjet to significant vibrations that will effect the final results.
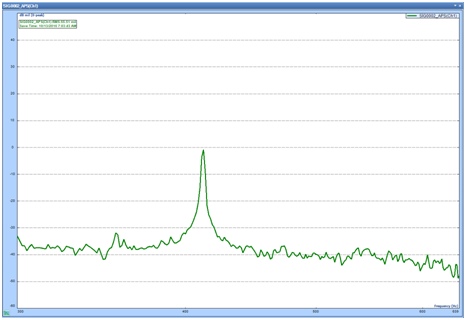
The initial test indicates a resonance of about 410 Hz on the beam.
Finding Phase Value and Q Factor
The next step would be to run a low level sine sweep around the approximate resonance frequency to determine the resoanance frequency accurately and also to find the Q factor and phase value at the resonance.

Test was controlled using the displacement measured on the tip of the beam using a Laser displacement sensor. Sweep speed was kept very low to ensure that the resonant frequency and phase were captures accurately and also to ensure that the displacement is kept low through control loop when the sine sweep passes through the resonance frequency.
This test was also run at a very low amplitude level to ensure that the test object is not subject to big vibrations.
From analyzing the FRF obtained between the two channels, it was observed that the Resonance was found to be at 411.46Hz with a phase of -112.78 degrees and Q – factor of 2048.

Tracking Resonant Frequency:
The resonant frequencies can be tracked using the Amplitude or Phase, tracking using the changes to Phase is very quick and an efficient way to continually subject the test object to vibration at its resonance. It exploits the characteristic of the materials that the Phase at the resonance is constant even when the resonant frequency has changed. From the Slope of the phase curve and the phase value, Spider can track the change in resonances accurately and quickly.
Resonance frequency tends to change when more energy is fed to the test object. So, an efficient way is to start tracking at the level at which the test was initially run and then gradually increasing the level to the highest level.
Using the Crystal Instruments’ EDM software, this can be easily configured as shown above. The number of levels, the amplitude at the each level and the duration to dwell on each level can be customized.

One such plot that shows the changes in amplitude with respect to the number of cycles is shown.
A steep drop in the Amplitude signifies fatigue of the test object. The number of cycles at which the test was run along with the number of cycles at 100% level which was needed to make the test article fatigue can be easily determined from these plots.
References:
https://www.spaceflight.esa.int/impress/text/education/Circular%20Motion/Turbine_Blades.html