
Subwoofer Enclosure Design Validation Using Modal Analysis
Download PDF | by Ziyuan Jiao | Graduate Student, M.S.E ‘18 | University of Michigan, Ann Arbor, United States | © Crystal Instruments 2018, All Rights Reserved.
Introduction
A subwoofer is designed to reproduce low-frequency audios in a high-fidelity (hi-fi) loudspeaker system. Its operational frequency range for commercial products is about 20 – 200 Hz. Technically speaking, a qualified subwoofer should have a flat frequency response function (FRF) over its operational frequency range and avoids any significant peaks at a low-frequency region.
A good subwoofer does not only rely solely on its speaker, it utilizes the integration of its components effectively as well. A typical subwoofer consists of three fundamental parts: a speaker driver, cross-over circuits, and an enclosure (cabinet). The speaker driver consists of magnets, a voice coil, etc. Its main function is to generate acoustic energy, which is transmitted through vibration of air before reception on human ears. The cross-over circuit deals with input signals which attenuate high-frequency audio signals and sends low-frequency audio signals to the subwoofer driver. An enclosure provides support for the speaker driver and cross-over circuits. The ideal enclosure should be designed with a flat FRF for all frequencies to avoid significant vibrations. One of the main causes of sound distortion for most loudspeakers offered in the market is the presence of undesired sound caused by enclosure vibration. To improve the performance of a subwoofer, the dynamic model of its enclosure should be examined during product development.
The modal analysis method is widely used to validate the design of subwoofer enclosures and to obtain its structural dynamic characteristics. Crystal Instruments provides a world-leading modal analysis system based on the Spider-80X system and Engineering Data Management (EDM) software. By measuring the dynamic response from different points of the enclosure, the modal frequencies, damping factors and mode shapes can be located through EDM. Customers can use the dynamic model retrieved from modal tests to find potential vibration issues inside the structure in advance. This test note describes a modal test on the enclosure of a widely used commercial household subwoofer with a rated frequency response range of 32 – 120 Hz, including an evaluation on its enclosure design.
Subwoofer Model
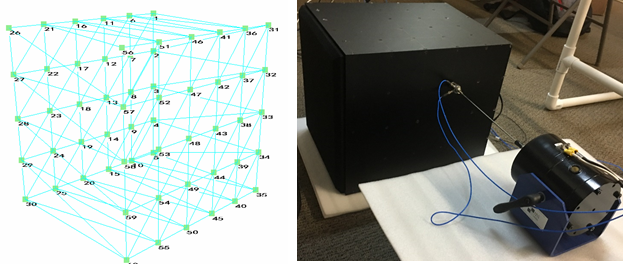
The subwoofer is modeled with 5 x 4 grids on each side face and has 60 measurement points in total (30 for each face). The subwoofer is placed on soft foam which ensures a free-free boundary condition. The modal shaker test with burst random excitation signal (50% period, 0.05 amplitude) is used in this experiment. The modal shaker’s impedance head is mounted on No. 42 to measure the +z (vertical) force. The accelerometers roves from node No.1 to No.60 during the experiment.
Frequency Response Measurement
The frequency range of this test is set to 450 Hz, with a block size of 4096. With this setup, as shown in the following figure, the response signal from the accelerometer decays to zero within the current block size, thus no window is needed for leakage. At each test point, EDM Modal records measurement data from the linear mean of 8 acceptable response data points. A larger number of frames could be selected to further attenuate the signal noise (at the cost of increased testing time).

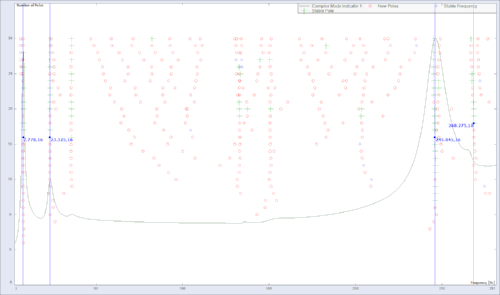
In total, 60 FRFs are acquired after roving the hammer through all 60 nodes. They are plotted in a semi-log plot shown in the following figure. From the plots, two peaks can be observed below 30 Hz, and the FRFs are flat and smooth between 30 ~ 200 Hz. A major peak presents at around 250 Hz.

Modal Analysis Result
With the help of a Mode Indicator Function (MIF), the modal frequencies can be labeled. For the subwoofer tested in this experiment, its rated frequency response is about 32 – 120 Hz. To include all three significant modes shown on the FRFs above, the frequency band of 3 – 261 Hz is selected to generate a stability diagram.

From the stability plot, no mode is found in its rated frequency respond range (32 – 120 Hz) and 4 modes were identified in total.
Mode shapes of each mode are shown below. Three different views provide a comprehensive assessment of the mode shapes.
Mode 1 occurs at 7.778 Hz, with 6.251% damping. The top face of the subwoofer deforms along the y-axis.

Mode 2 occurs at 23.325 Hz, with 6.408% damping. The front and back faces of the subwoofer moves along the y-axis in the opposite direction.

The above two modes are primarily caused by the instability of the rectangular shapes. Their modal frequencies are less than 32 Hz, which is below the lowest band of the rated frequency response range. Generally speaking, these two modes would not add significant vibration noise to the audio output. To attenuate the peaks of these two modes in FRFs, features like a struct can be added to increase the enclosure structural rigidity.

Mode 3 occurs at 245.845 Hz, with 2.270% damping. The central front portion of both side faces deform along the y-axis in the same direction (in phase).

Mode 4 occurs at 268.275 Hz, with 0.790% damping. The central front portion of both side faces deforms along the y-axis in the opposite direction (180 degree out-of-phase).

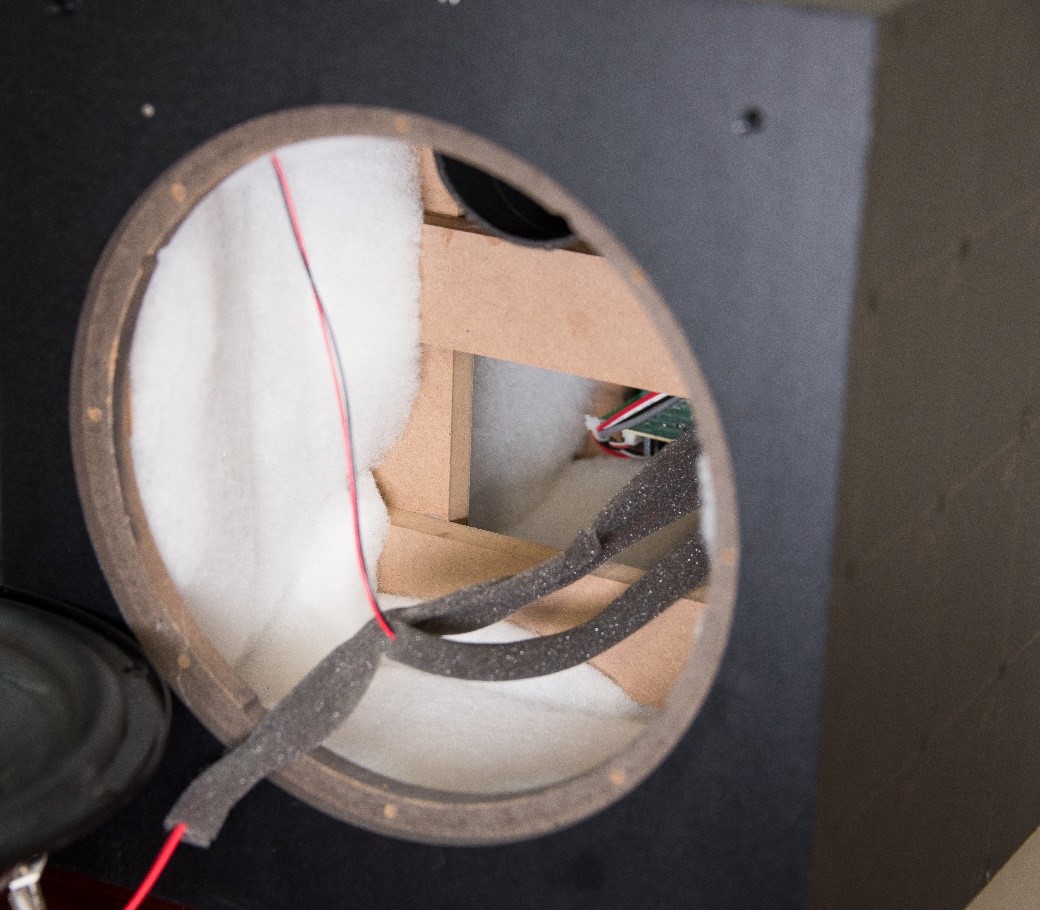
The above two modes are primarily caused by the flexibility of the side surface. Their modal frequencies are larger than 120 Hz, which is above the highest band of the rated frequency response range. These two modes will not add significant vibration noise to the audio output. To attenuate peaks of these two modes in FRFs, the manufacturer of the subwoofer decided to use cotton to absorb audio energy transmitted to enclosure.
Conclusion
Based on the modal analysis results, the subwoofer enclosure design exhibits the desired flat FRFs over its frequency response range. For modal frequencies near a frequency response range, the manufacturer took reasonable measures to avoid potential vibration issues. In conclusion, the enclosure design fulfilled its requirement and is validated for audible transparency.