
Vibration Criteria for Facilities with Sensitive Equipment
Download PDF | © Copyright Crystal Instruments 2016, All Rights Reserved.The vibration environment of facilities used for research, photolithography, microelectronics manufacture, and similar activities has a significant effect on the performance of the equipment used within. As the dimensional requirements of today's equipment and processes become more demanding, their sensitivity to external vibration increases. When designing such facilities, the stiffness of the floors and supporting structure must be such that the vibration levels are kept below that which causes problems for the equipment.
Determining these appropriate levels can be difficult. Equipment specifications for vibration tolerance are often vague, misleading, or non-existent. Instead, a series of generic criteria have been developed based on available specifications, tests, and experiences that can apply to broad classes of equipment. Facilities can be designed with these generic criteria for the classes of equipment that they will use.
The first generally accepted set of criteria was developed by Eric Ungar and Colin Gordon in the early 1980s and were known as the "BBN" criteria. The criteria have gone through a number of changes since then, and are now standardized by IEST.
Vibration Measurement
All of these criteria are defined as RMS velocity spectra in 1/3 octave bands. Rather than specifying the vibration levels in fixed bands, proportional bands are used because they provide a more meaningful measure of how a structure reacts to broadband excitation at its resonant frequencies. It can be shown that a resonance of a given damping ratio responds with the greatest sensitivity to a frequency band of a width proportional to its natural frequency.
Most modern facilities, with adequate isolation of ventilation equipment and other rotating machines, have a vibration environment dominated by broadband energy and little pure tone energy. This broadband energy assumption is the basis for using proportional octave bands.
Vibration measurements should be made in 3 directions (vertical and 2 horizontal), and averaged over an adequate time period. In a steady-state or quasi-steady-state environment, linear averaging should be used. In an environment that is impacted by occasional disturbances or transient events, peak hold measurements should be made.
In large spaces, where a single location may not be representative of the whole, multiple measurements should be made throughout and then averaged together in log space. If an is the spatially averaged measurement and a1, a2,... are the individual measurements, then the log-space average is defined as
log(an) = log(a1) + log(a2) + ⋯
IEST Criteria
The IEST criteria originally came in 4 levels, called VC-A (or “Vibration Criteria-A”) through VC-E. VC-F and VC-G have also been developed, but these were defined to characterize extremely quiet lab spaces, and not intended as design targets. The criteria definitions are shown numerically in the table below.
| VC-A | 260 mg between 4 Hz and 8 Hz; 50 μm/s (2000 min/s) between 8 Hz and 80 Hz |
| VC-B | 130 mg between 4 Hz and 8 Hz; 25 μm/s (1000 min/s) between 8 and 80 Hz |
| VC-C | 12.5 μm/s (500 min/s) between 1 and 80 Hz |
| VC-D | 6.25 μm/s (250 min/s) between 1 and 80 Hz |
| VC-E | 3.1 μm/s (125 min/s) between 1 and 80 Hz |
| VC-F | 1.6 μm/s (62.5 min/s) between 1 and 80 Hz |
| VC-G | 0.78 μm/s (31.3 min/s) between 1 and 80 Hz |
NIST-A Criterion
The NIST-A criterion is identical to the VC-E curve at frequencies above 20 Hz, but maintains constant displacement at frequencies below this.
| NIST-A | 0.025 μm or 25 μm (1 min) between 1 and 20 Hz; 3.1 μm/s (125 min/s) between 20 and 100 Hz |
Measurements on the CoCo
The CoCo portable signal analyzer is well suited for taking 1/3 octave vibration measurements. The Octave Analysis functions are found under the Acoustic Analysis CSA Application Group. Any of the projects title Oct() will work, with the number in the parenthesis indicating the number of channels available.
There are also CSA projects available with the vibration criteria built-in. This allows direct comparison of the measured data with the limits of a particular vibration criterion. These projects can be created in the EDM desktop software by the user, using any criteria the user selects. Setting these projects up is explained in the next section.
In an octave project, the analysis parameters are set under the F2 (Param) menu. The Octave Resolution should be 1/3, and the frequency range should be set to cover the frequency range specified by the criteria. The average type should be set based on the expected vibration environment. For environments characterized by transient events, Peak Hold should be used, and for environments that are assumed to be steady-state over th emeasurement period should probably use Linear averaging. The Time Weighting as well as the Time Hold settings should be set to the time duration, in seconds, of the measurement. Lastly, unless frequency weighting is specified in the criteria, the Frequency Weighting option should be set to ‘Z’.

Analysis Parameters for Octave Analysis
To view the octave bands in real-time, use the F1 (Traces) button to select the window with the Octave() signals. The display windows on the CoCo can be customized to display the channel or channels of interest. To change the current window, select Trace and Window Settings under F1 (traces). In the window setup screen, a list of signals that can be displayed will be shown, and all the ones that are currently selected for this window have a check mark in the rightmost column. To toggle the checkmark, select the row with the desired signal and press the Enter key.

The F1 (Traces) menu shows all the currently defined display windows

The Trace and Window Settings screen
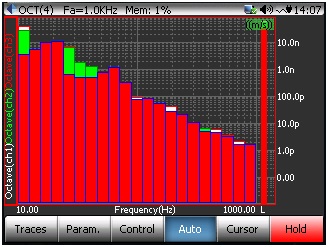
Real-time octave display
Creating CSA Projects with Octave Limits
Use the CSA Editor in EDM to create Octave CSAs with limits defined. To do this, first create a new CSA by clicking the CSA Editor button in the upper right corner, and select Octave Analysis.
Then, define the limits according to the vibration criteria that will be used. Click on the Limits button on the toolbar to open the Limit Editor. All previously created limits will be shown in the upper left of the window, and a new limit can be created by clicking the Create button. Make sure the Apply to Type is set to Octave Spectrum, and the Octave Resolution is set to 1/3. Then the limit values can be entered in the breakpoint table in the lower left.
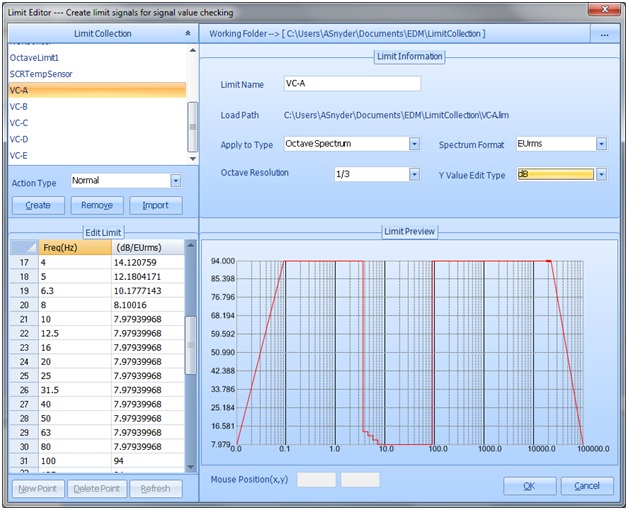
Defining Octave Limits in the Limit Editor
After the limits are defined, they need to be assigned to the Octave Spectrum for each channel. The lower half of the CSA Editor screen lists the OCT outputs for each channel. Select the Enable Limit Binding option, and then for each channel click on Bind Limits. In the Bind Limits window, enable the limit that contains the vibration criteria to be used as High Limit.

Binding limits to Octave channels in the CSA Editor
When finished, connect the CoCo to EDM and press Send To CoCo. The Project can then be run on the CoCo.
To display the limits, go in to the Limit Signals Display Setting under F1 (Traces), and make sure the limit signals are enabled (shown by a checkmark in the right column). The limits will then be overlaid on the octave display.

Octave Limit display on the CoCo