Managing Signals Between DSA and VDC Modes (CoCo-80)
Download PDF | © Copyright Crystal Instruments 2016, All Rights Reserved.Contents: 1. Manage the VDC Database | 2. Acquiring a Measurement on the CoCo-80 in DSA Mode | 3. Download Data Files from CoCo to the PC | 4. Attach Signals to the Database in EDM with VDC Mode | 5. Peak Search of Many Spectra
This product note describes how to manage signals acquired in the CoCo DSA mode and associate them with a machine structure in the VDC database. It also demonstrates how to perform analysis on such signals including the Peak Search function.
For day to day condition monitoring the CoCo can be used in VDC mode where a database is defined consisting of factories, machines, points and routes. However when a particular problem is identified, the CoCo can also be used in DSA mode for more advanced analysis such as octave spectra from a sound source, order spectra from a rotating machine or long time waveforms from a vibration source, etc. DSA mode measurements are not associated with the machine structure automatically. After the signals are downloaded from the CoCo to the PC using the EDM software, the measurements can be attached to the machine structure so that the measurements are associated with the machine in the database for future reference. After the signals are associated with the machine structure they can be analyzed using various tools including the Peak Search function.
The following demonstrates a typical process including managing a database, acquire measurements with the CoCo in DSA mode, downloading data from the Coco to the PC, attaching signals to the database and finally performing a peak search analysis.
1. Manage the VDC Database
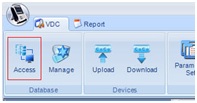
A database must be identified before signals can be attached to it. You can use an existing database or create a new one. Click on the Access button in the Database toolbar.
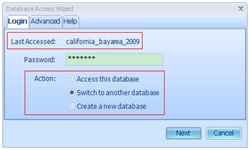
Next you can choose to access an existing database, switch to another database or create a new database.

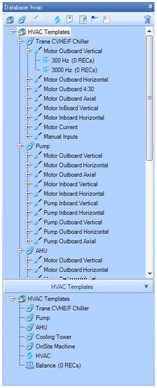
When a new database is created, it automatically contains a default factory and a default route as shown in the database explorer. Items in the database have a hierarchical structure.
When you highlight a factory, a machine, a point, or an entry, its components are shown in the bottom pane. The hierarchical structure is summarized below.
 : a Factory contains machines and routes.
 : a Machine contains points.
 : a Point contains entries.
 : an Entry contains Measurement Records (Waveforms, Spectra, and Readings), Alarms, and Trend.
 : a Route is a predefined collection of points that are measured for condition monitoring.
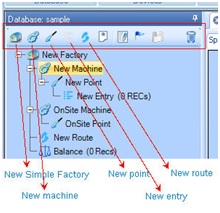
The buttons at the top of the database explorer let you create and modify items in the database. Buttons are highlighted if they are available operations and grayed if they are not available for the current selection.
By clicking on explorer buttons, you can create database items such as Factories, Machines, Points, Entries and Routes.
You can also right-click on each item to open a pop-up menu. The menu contains additional convenient commands for designing the database, such as edit, delete, copy, duplicate, etc.
For more detailed description of database operations, please refer to the VDC Users Guide.
The figure below shows an example of a database with multiple Machines, Points and Entries. After a database is created you can attach signals but first you must acquire and download the data from the CoCo device.
2. Acquiring a Measurement on the CoCo-80 in DSA Mode
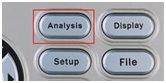
The following is a brief summary of the steps to acquire a measurement on the CoCo-80 in DSA mode. First, press the Analysis button on CoCo and select a CSA group and a CSA that you would like to run.


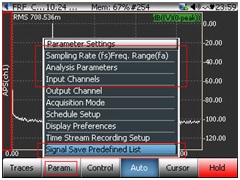
Next, press F2:Param. to setup the sampling rate/freq range, analysis parameters, and input channel table. Then select the Signal Save Predefined List to mark signals (spectra) you would like to save.

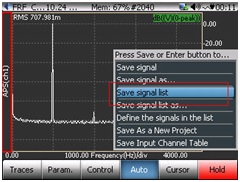
Next press the F6: Run button to run the CSA and start acquiring data. Then press the Save button and select Save Signal List. Those preselected signals (spectra) are saved in a file called SIGxxxx.


Press the File button to see the list of saved signals. The figure below shows an example with files SIG0093 through SIG0102 saved.

3. Download Data Files from CoCo to the PC
Now that the signals are saved on the CoCo you can download them to the PC using the EDM software in DSA (Dynamic Signal Analysis) mode.
Connect the CoCo to the computer via one of the following connections: USB, Ethernet, or crossover Ethernet cable. Press the Search toolbar button to locate the CoCo connection and then press the Connect button. Refer to the CoCo manuals or technical documents on the CI support site for more details or step by step guides to managing the CoCo-to-PC communication.
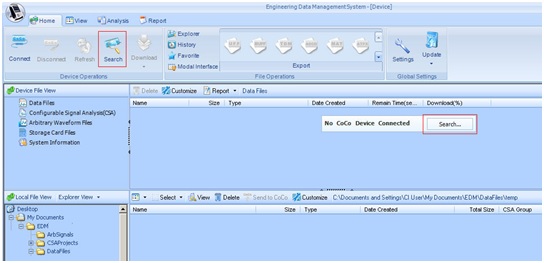
After the connection is established between the CoCo and the PC you are ready to download the signals. Select the folder where you want the signals to be saved in the lower pane and select the signals that you want to download from the CoCo on the top right pane and press the Download button on the toolbar.

Notice the status as the signals are downloaded to the folder and displayed in the bottom right pane. Now the data is saved on the PC hard drive. At this point you can view and analyze the signals in DSA mode or as shown below, switch from DSA to VDC mode and attach the signals to the machine structure database. Note that in DSA mode data is not automatically included in a database structure as in VDC mode. Each measurement is saved as a separate data file with no machine, point or route information.

4. Attach Signals to the Database in EDM with VDC Mode
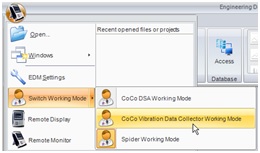
In order to associate the signals from DSA mode with the database you must attach them to the database structure in the EDM software in VDC mode. First, change from DSA to VDC mode in the EDM software by selecting CoCo VDC Working mode from the Start/Switch Working mode menu.
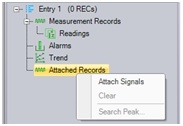
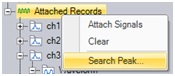
Next, select an entry in the database and point to the category called Attached Records under the entry. Right-click on Attached Records and select Attach Signals from the pop-up menu. A dialog will pop up and let you select on ore more signals to attach.
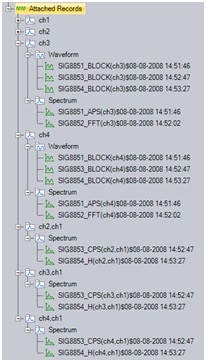
Under Attached Records, signals are classified by channel and signal types (time waveform or frequency spectrum). The display-name includes the file name followed by the signal name plus a time stamp. The figure below shows an example of several signals attached to the machine structure.
5. Peak Search of Many Spectra
After the signals are attached you can analyze them with the EDM software. The example below shows a peak search among several spectra. First, right-click on Attached Records and select Search Peak from the pop-up menu.
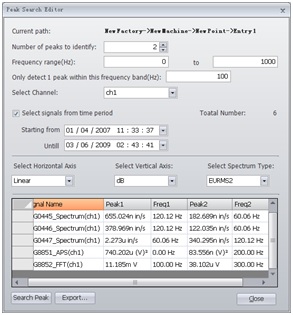
Enter the search criteria in the Peak Search Editor including:
Number of peaks to identify
Frequency range: search peaks in this frequency range
Only detect 1 peak within this frequency band: any smaller peaks in the frequency range centered on a large peak, will be ignored.
Select channel: search peaks among all signals under the selected channel
Select Signal from Time Period: search peaks among signals generated in the time period.
Horizontal Axis, Vertical Axis, Spectrum Type: format of spectrum. For peak detection, it should be Linear, Mag, EUpeak.
Click on Search Peak and peaks will be shown in the table and sorted from largest to smallest.
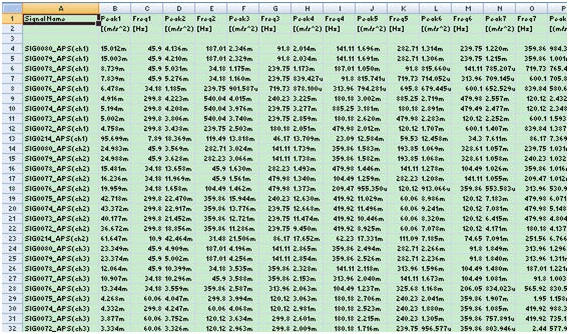
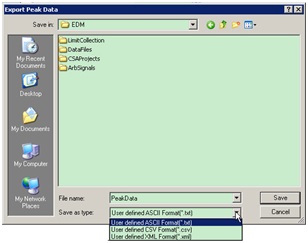
After the peaks are found they can be exported to a file. Press the Export button in the dialog box and select one of the file formats: txt, csv, and xml.
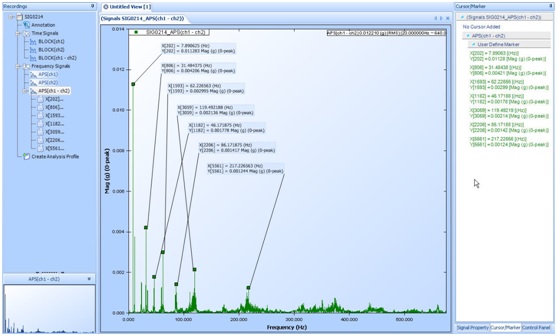
Below are three examples of peak searches with the same data but using different search criteria and the search results presented below.
Example 1
The following figures shows the peak search results with
Number of peaks to identify = 7
Frequency range = 0 – 1,000 Hz
Only detect 1 peak within this frequency band = 20 Hz
Example 2
Number of peaks to identify = 7
Frequency range = 0 – 1,000 Hz
Only detect 1 peak within this frequency band = 10 Hz
Peak 6 at 23.09 Hz wasn’t in the search results because “Only detect 1 peak within this frequency band” is smaller in this case.


Example 3
Number of peaks to identify = 20
Frequency range = 0 – 1,000 Hz
Only detect 1 peak within this frequency band = 20 Hz
Select Channel: All channels