
Save & Recall Display Signals with Ease
Crystal Instruments is committed to the continuous innovation of our solutions and providing the best user experience possible. By adopting the latest developments in software technology, our team has developed a convenient modern aesthetic in addition to a feature-rich experience for Engineering Data Management (EDM) software, which serves the entire product line.
For vibration testing and data analysis, it is necessary to quickly display their signals and observe their characteristics. EDM provides various display features to help users quickly set up a display range, display formats, or to save/recall a display.
New in EDM 8.1 Release:
1. Preserve Display Settings: "Save Tab" or "Save Window as User-defined"
Signals in EDM are shown in display windows. Each window contains signals of the same type. The second layer of the display are display tabs. Each display tab contains multiple display windows to offer modular flexibility and layout options.
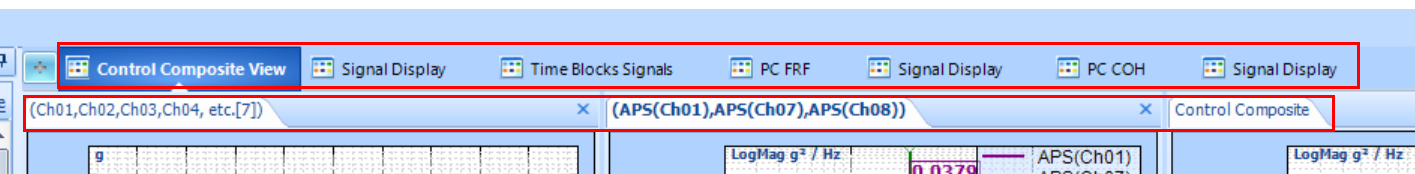
Starting from the EDM 8.1 release, users can save the following display settings through a display window or a display tab. Open the saved tab or the saved window (user-defined window), and all windows in the tab or the individual window will be created with the saved signals and settings applied.
This feature is very convenient when users need to close some display tabs or windows and re-open them later with their preserved display settings.
Signals on display windows
X-axis settings, including auto/fixed/fit options and min/max values
Y-axis settings, including auto/fixed options and min/max values
Horizontal axis format (Linear/Log)
Vertical axis format (dB/Linear Mag/Log Mag/…)
Spectrum type
Cursors
Markers
Signal color
Signal type
Legend
If a window is accidentally closed without being saved, users can quickly locate it in “Recent Windows”, where the last 10 closed windows are stored.
2. Copy/Paste Window Display Settings
The EDM 8.1 release introduces a new method to copy display settings from one window to another window. Users can copy the display settings of a current view and apply those settings to another display of the same signal type. If you would like to apply the same X-axis settings or Y-axis settings to all displays of the same signal type, double-click on the X-axis or Y-axis and choose the option to "apply to all". The following settings can be copied and applied to individual windows.
X-axis settings, including auto/fixed/fit options and min/max values
Y-axis settings, including auto/fixed options and min/max values
Horizontal axis format (Linear/Log)
Vertical axis format (dB/Linear Mag/Log Mag/…)
Spectrum type

3. Save Current Selections as Default Settings
Set the current selection as the default setting of the horizontal axis, vertical axis, and spectrum type. The default setting will be applied to new windows, not existing windows. For existing windows, users are recommended to use the of copy/paste feature of the window display setting.

4. Create Templates from Tests
The Display Tab, Windows, or Layout will be reconstructed when users create a test from a template. When a test is set as a template and a new test is created from it, the display tabs and display windows, including all their formats, will be replicated in the new test. Test templates preserve not only the test configurations, but also saves the display layouts and formats.

5. Customize Signal Color and Channel Display Group Size
The small icon located at the bottom left corner of each display window offers various options. Users can select which signals to display in the window.
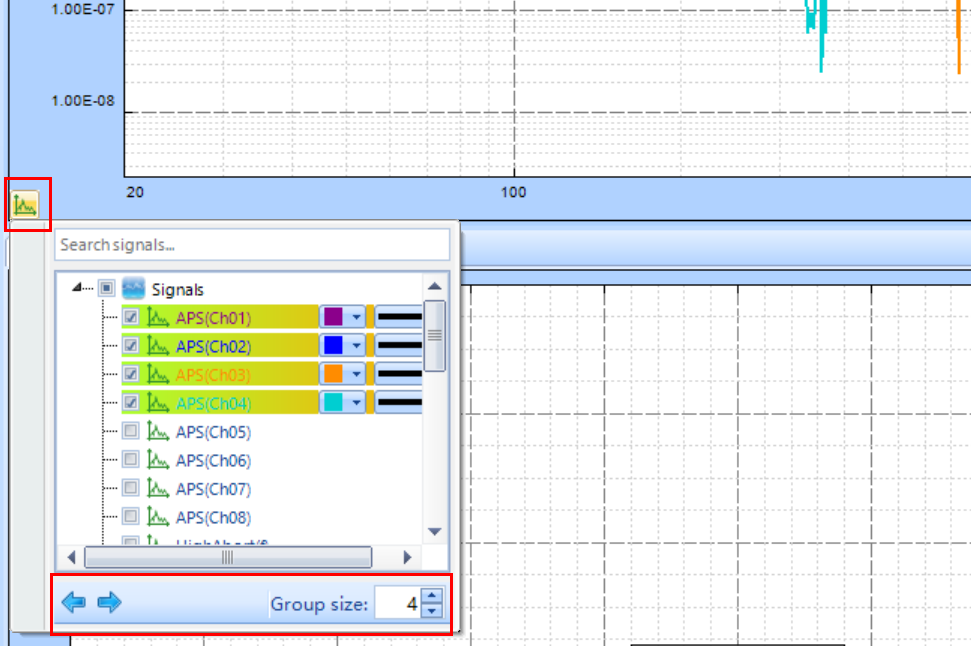
The default signal color is determined in the Measured Signals set up window. Users can select the icon to customize the signal color.
Users have 5 options to customize and select the line type of the signal. This is useful for printing reports in black and white.
Users can define the group size at the bottom of the window where the right and left display arrows are located. When the group size is determined, the right and left arrows provide an easy option to switch displayed signals.
In the following example, there are 64 channels in total. The user would like to display 8 APS signals at a time and quickly switch views between them. The group size will be set to 8 which will select channels APS(ch1), APS(ch2), APS(ch3), …, and APS(ch8). When the user clicks the left or right arrow, the signals in the display window will automatically switch between the following groups:
APS(ch1), APS(ch2), APS(ch3), …, APS(ch8)
APS(ch9), APS(ch10), APS(ch11), …, APS(ch16)
APS(ch17), APS(ch18), APS(ch19), …, APS(ch24)
APS(ch25), APS(ch26), APS(ch27), …, APS(ch32)
APS(ch33), APS(ch34), APS(ch35), …, APS(ch40)
APS(ch41), APS(ch42), APS(ch43), …, APS(ch48)
APS(ch49), APS(ch50), APS(ch51), …, APS(ch56)
APS(ch57), APS(ch58), APS(ch59), …, APS(ch64)
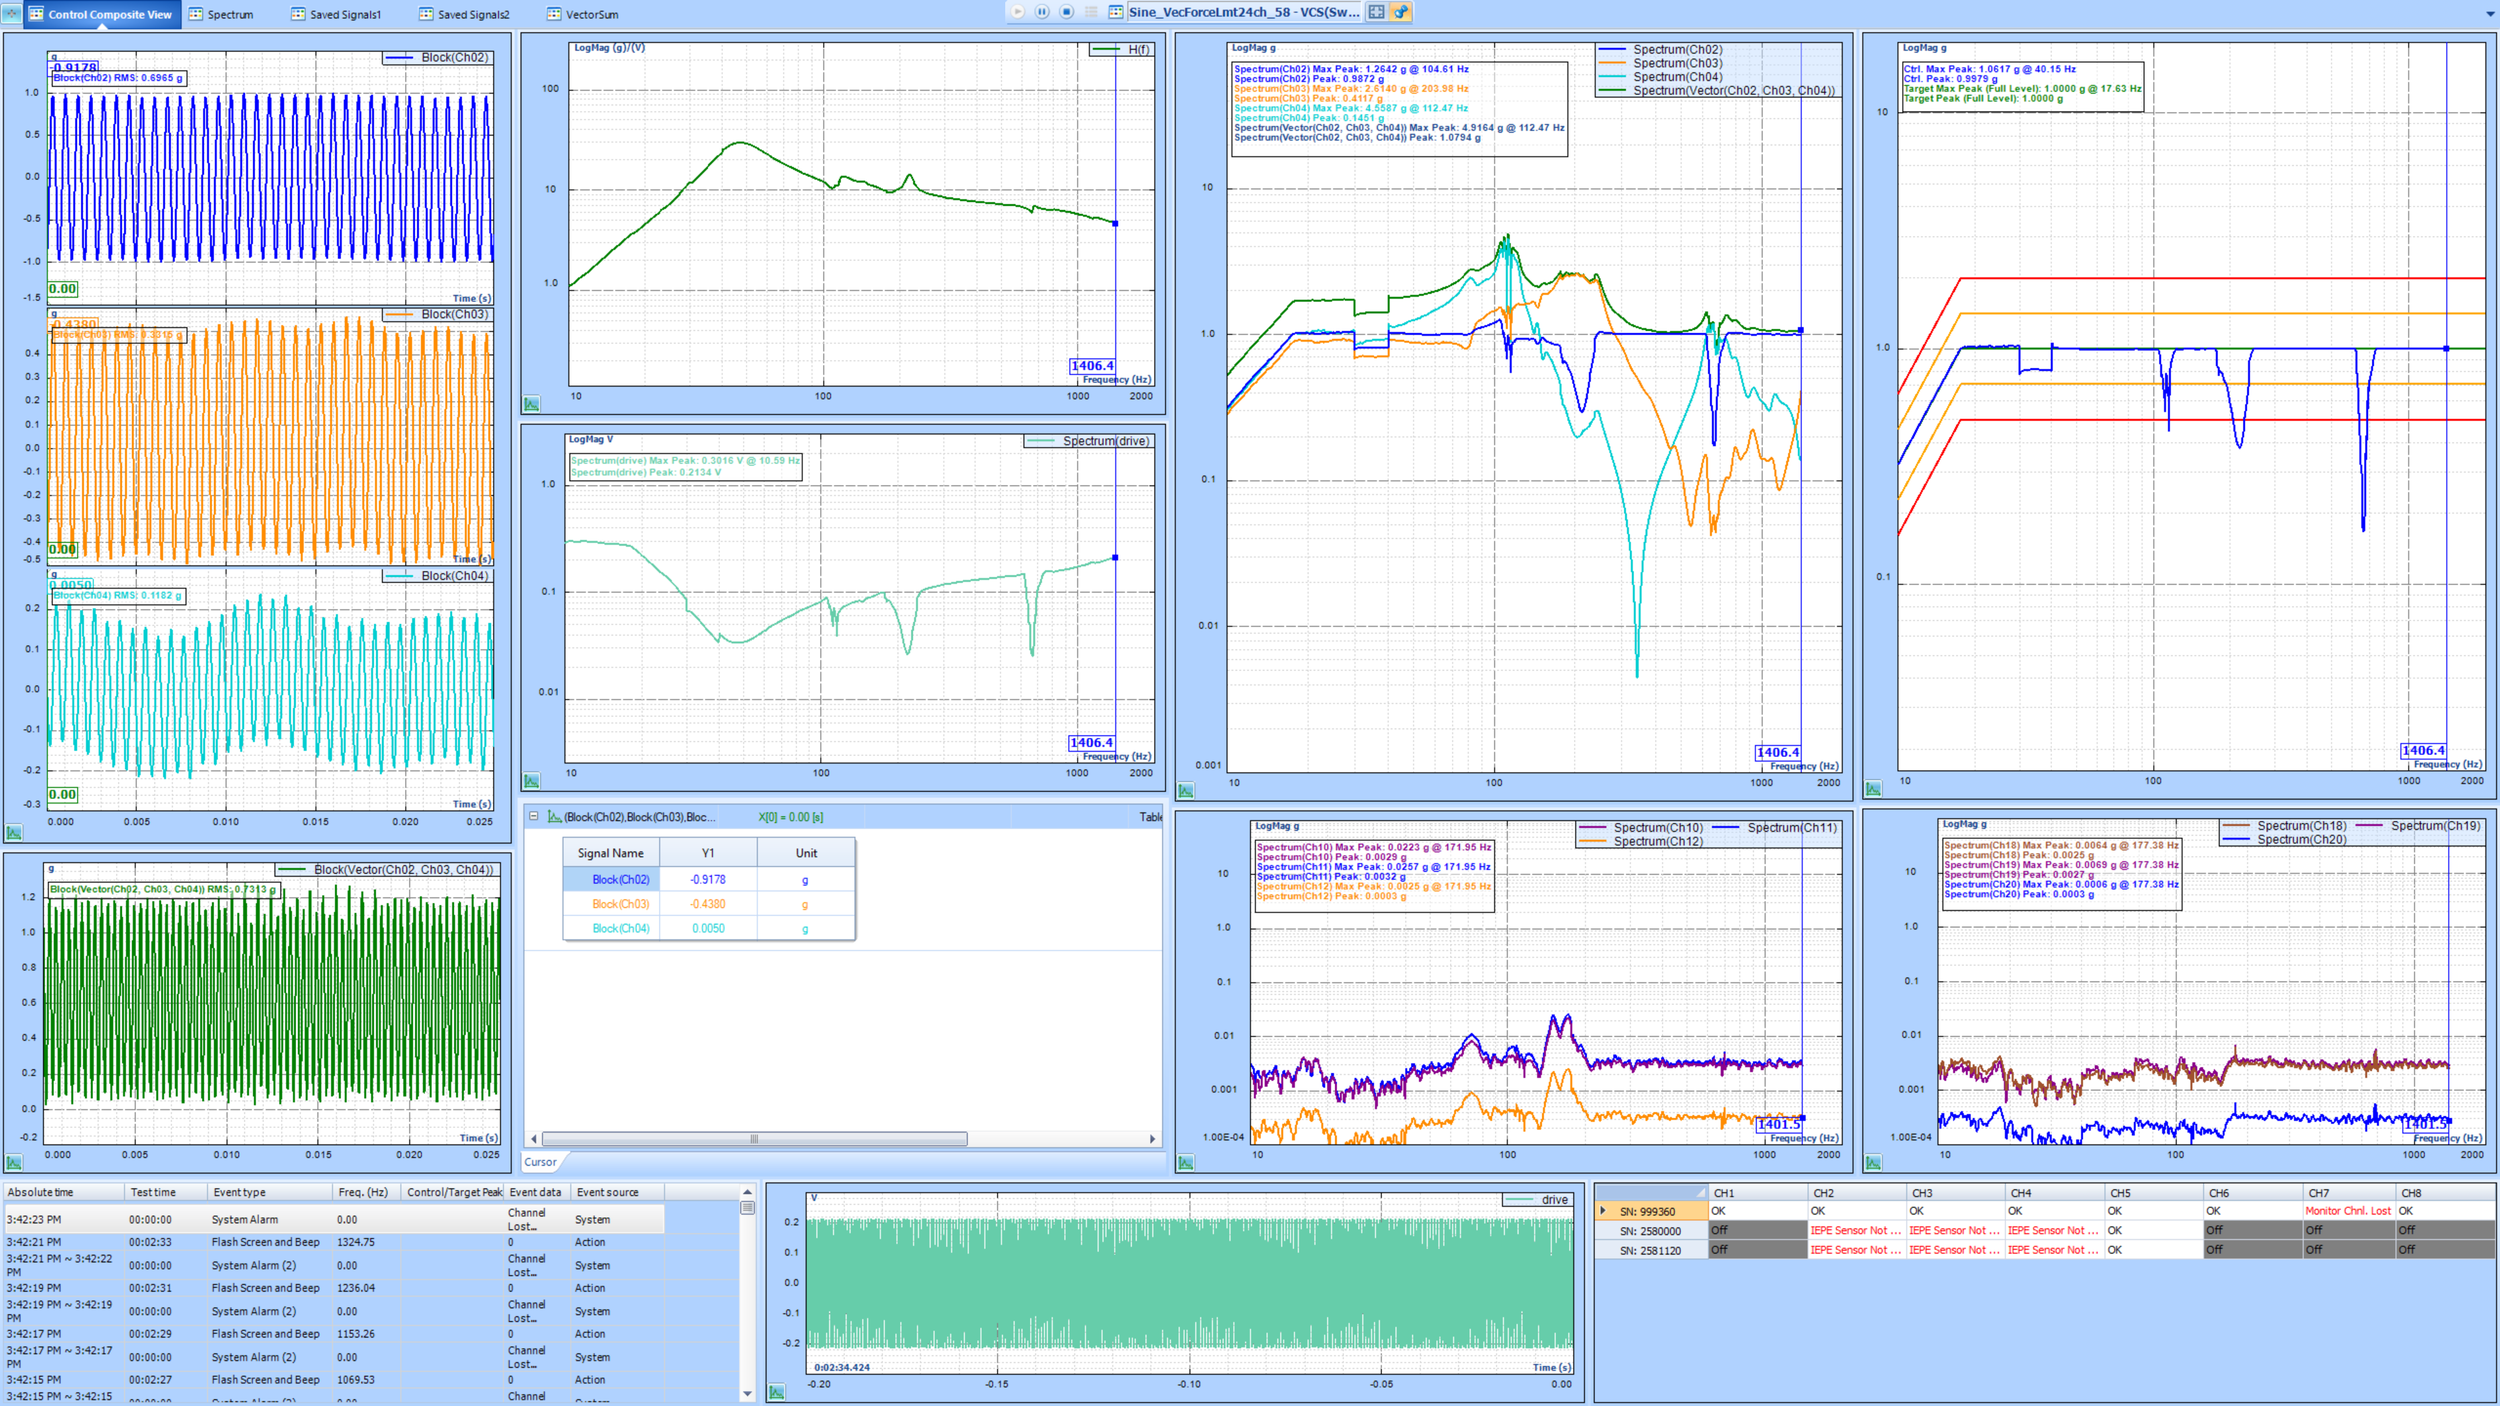
6. Full Screen Mode maximizes the display portion of the software to the whole screen and hides the control panel, test list, and signal list. Only a small toolbar is kept on the top of the screen. The toolbar contains buttons to run, pause/continue, stop the test, generate reports, and open the test.
Full screen mode provides the cleanest look and helps the user focus on relevant test information.


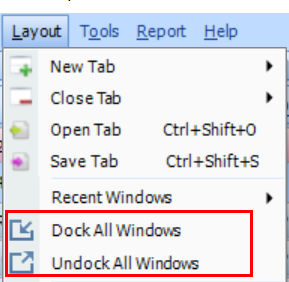
7. Undock/Dock Windows
When display windows are docked, they are embedded in the software and their size changes when the software window changes. When docked windows are organized, the layout is retained and their size and position changes with the software.
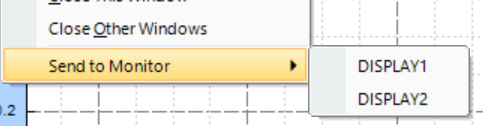
When display windows are undocked, their sizes and positions change freely without the restriction of the software. If there are multiple monitors, the software is displayed on one monitor and undocked windows can be displayed on other monitors by using the key combination of Windows + Shift + arrow key to move the window to another screen.
The "Send to Monitor" feature undocks the selected window, moves it to the designated display, and maximizes it.
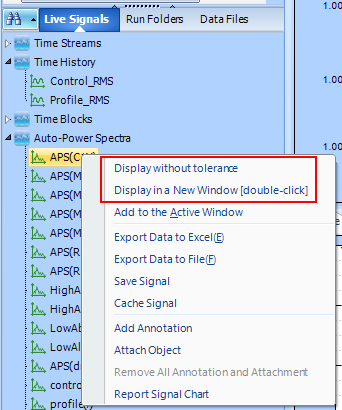
8. Quickly Display Spectrum with Tolerance
By configuring the tolerance setting in the right-click menu, the behavior of double-clicking the input spectrum signals changes. When no tolerance is selected, double-clicking on an input spectrum signal opens a window with it. When a tolerance is selected, double-clicking on an input spectrum signal opens a window with it and the selected tolerance.
This feature is especially useful if the user would like to compare a few input spectra with tolerance signals in separate windows.
When a few signals are selected in the tolerance display:
Double-click to display with tolerances
Right-click to display without tolerances

When no signal is selected in the tolerance display:
Double-click to display without tolerances
Right-click to display with tolerances

