
View Statistics Time History Signals in Vibration Control Software
Crystal Instruments recently released version of EDM 8.0 software allows users to view the selected characteristics (e.g., Peak, RMS or Peak to Peak) of a channel versus time for the entire duration of the test. This feature is included in all vibration control tests and allows users to track user-defined characteristics of any channel (including the control signal) for the duration of a test.
Users can conveniently customize this new feature by selecting the “Statistics Time History” tab of the “Measured Signals Setup” section of EDM. Once customized, the user can view the history of these signals by opening a signal at any time or the user can view the entire history of these signals at the end of the test.

The Statistics Time History signals are uploaded to the PC through EDM-VCS software. This provides users with immense flexibility to view any part of the history and allows storage of these signals for the duration of test runs. Users also have the ability to select how frequently these parameters must be calculated and updated. With the only limitation being the disk space on the PC, users can effectively record signals for several hours or even several days.

This feature is especially useful for users to plot the monitor channels’ Peak or RMS for the entire duration of the test and to look for any abnormalities. Users can also plot the control channel to track changes and its proximity to the profile for the entire duration of the test.

Users can record and view these signals at any time during or after the test. Since the recording is designed to run in the background, the recording is reliable even when these signals are not open for display. The user can conveniently open or close these signals and still view any portion of the history or the entire duration of history.
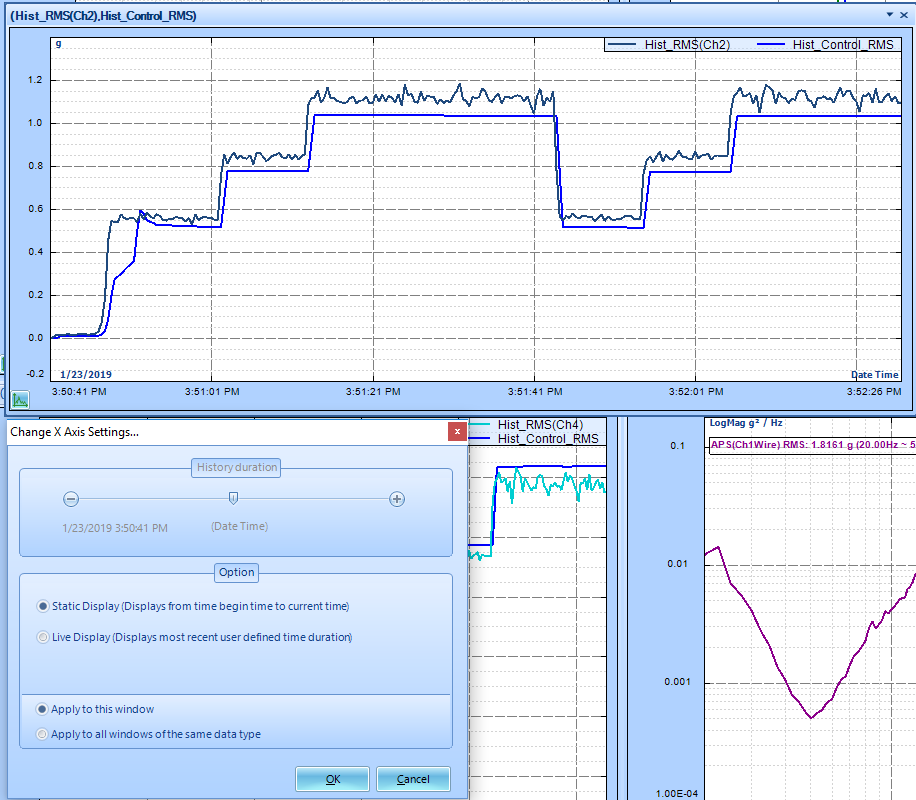
The time duration of vibration control tests is extremely variable, with some tests running for several days while some others conclude in less than an hour. Keeping the duration in mind, two convenient ways to display these signals are implemented. Users can choose to view the entire history while being updated with the new data, which is useful for shorter duration tests, or the user can choose to display the selected historical data (e.g., last 2 hours) to be displayed while being updated with the live data. The user also has the option to keep the display static without updating and can analyze the data between two user defined historical times.
Users will appreciate this powerful and convenient new feature that provides a wide range of useful options to display and configure the characteristics of channels in a test system.