
'Listening' to Cape Canaveral: How GPS-synchronized data acquisition turned cracked windows into actionable data
In the 1960’s rockets used to just go up. Fast forward to today; and rockets are now supersonic boomerangs; they come back down! The point being that the acoustic energy environment around the Kennedy Space Center and the pads at Cape Canaveral in Florida has fundamentally changed because of it! And the structures near active launch complexes are now loaded by two very different events than when those buildings were built: the long, broadband rumble of a launch, sustained over 20 to 30 seconds, and the landing was a very short, ultra-high-intensity impulse as the returning booster goes supersonic on the way down, breaking the sound barrier at 30,000 to 40,000 feet and producing three distinct sonic booms from the nose, base, and grid fins all under 3 Hz. Public data puts acoustics around the landing event at 115 dB SPL two miles from the pad, but our customer reported measuring acoustic levels “substantially higher”. For a major aerospace contractor based at Cape Canaveral, the problem announced itself when windows started cracking.
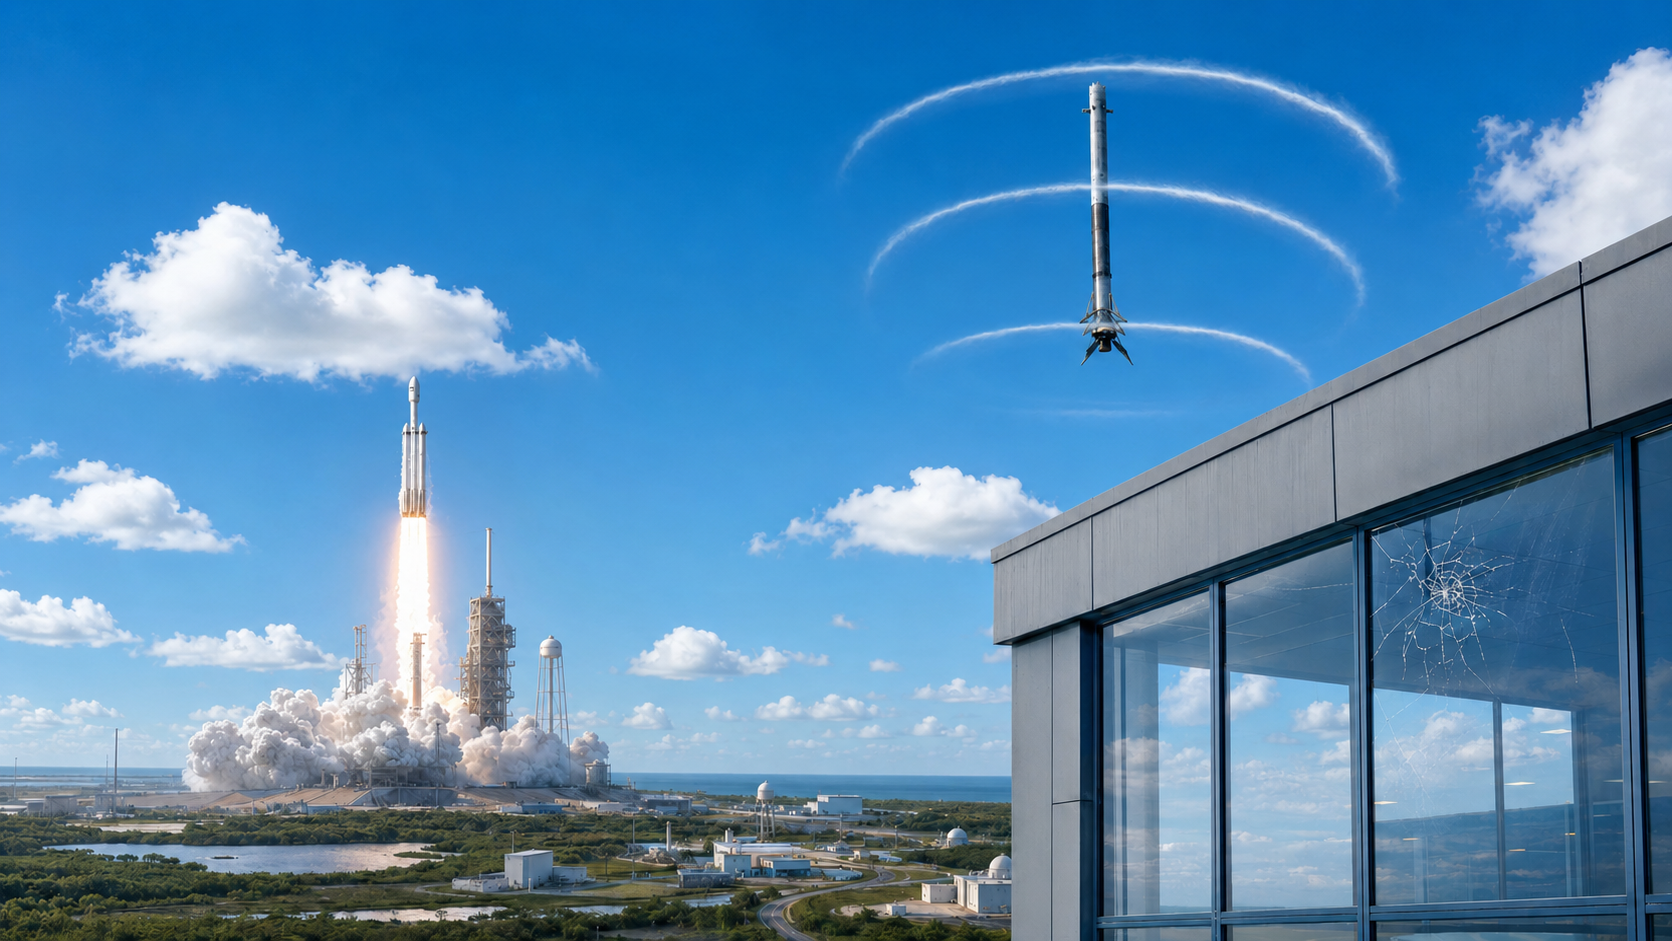
Illustrated image of the major aerospace contractor’s facilities in Cape Canaveral, Florida
It started with cracked windows
Physical damage began appearing in one the US Space Force’s facilities this contractor uses. It’s a 60,000-square-foot launch support building about two miles from launch complex SLC-36. Windowpanes were cracked, and the cracks kept growing. The damage tracked with launch and landing activity, but no data had ever been captured during those events. As the customer put it: "We were wondering what we don't know." The cracked glass was the visible symptom. But the real question was what was happening to the structure that they couldn't see and to the people inside.
A brief, unrepeatable event across a large area
Measuring the problem proved harder than identifying it. The landing impulse lasts only a fraction of a second. You capture it on that pass, or not at all. There is no asking a rocket for a second chance! The structural response also has to be measured from the roof to the fence line, across points spread over hundreds of feet. And dozens of channels across a structure must share a single, trustworthy time-clock, or the measurements can't be compared at all.
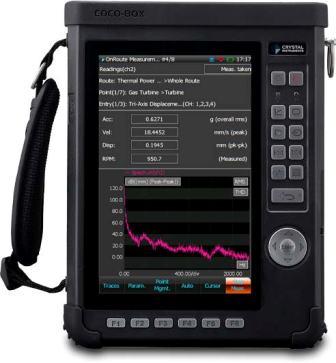
CoCo-80X handheld data recorder, supported and built in the USA
The first campaign used three 8-channel Crystal Instruments CoCo-80X handheld recorders, and it proved the problem was real! Crews were cleared from a Space-Force required exclusion zone well before the launch window opened, so our customer hit record and evacuated, leaving the units recording blind and unattended for hours. There was no way to start, check, or stop acquisition once the exclusion zone was active. And each recorder ran on its own clock, so aligning events afterward meant exporting every channel to spreadsheets and matching timelines by hand. Anyone who’s had to play with Excel at 2 am on a Tuesday knows how much fun that can be. This time-alignment required hours of labor before analysis could even begin. Whatever came next had to do two things the portable recorders couldn't: operate remotely from outside the exclusion zone with eyes on the data, and time-synchronize every channel on every box to one shared clock. One note here as well: based on this customers feedback we have since added GPS capabilities to our Coco-80X platform.
One platform, one timeline
The answer was the Spider-80Xi, our GPS-synchronized distributed data acquisition and analysis platform. Each chassis carries its own timeclock, so the system scales across any number of locations or buildings instead of forcing every cable back to a single chassis. And with its GPS synchronization capabilities enabled, each system is locked to the same timeline. Chassis without a shared network each lock via GPS to better than 60 nanoseconds, staying on one timeline even across separate buildings from 300 feet or 300 miles apart! Chassis on a shared Spider-HUB switch synchronize via IEEE 1588v2 to better than 100 nanoseconds and a phase match within ±1° at 20 kHz. So while our systems ‘can’ synchronize across shared cabling via a network switch, they no longer ‘have’ to do so. Accelerometers captured the structural response, while microphones captured the acoustic field driving it, together on the same platform and the same clock.
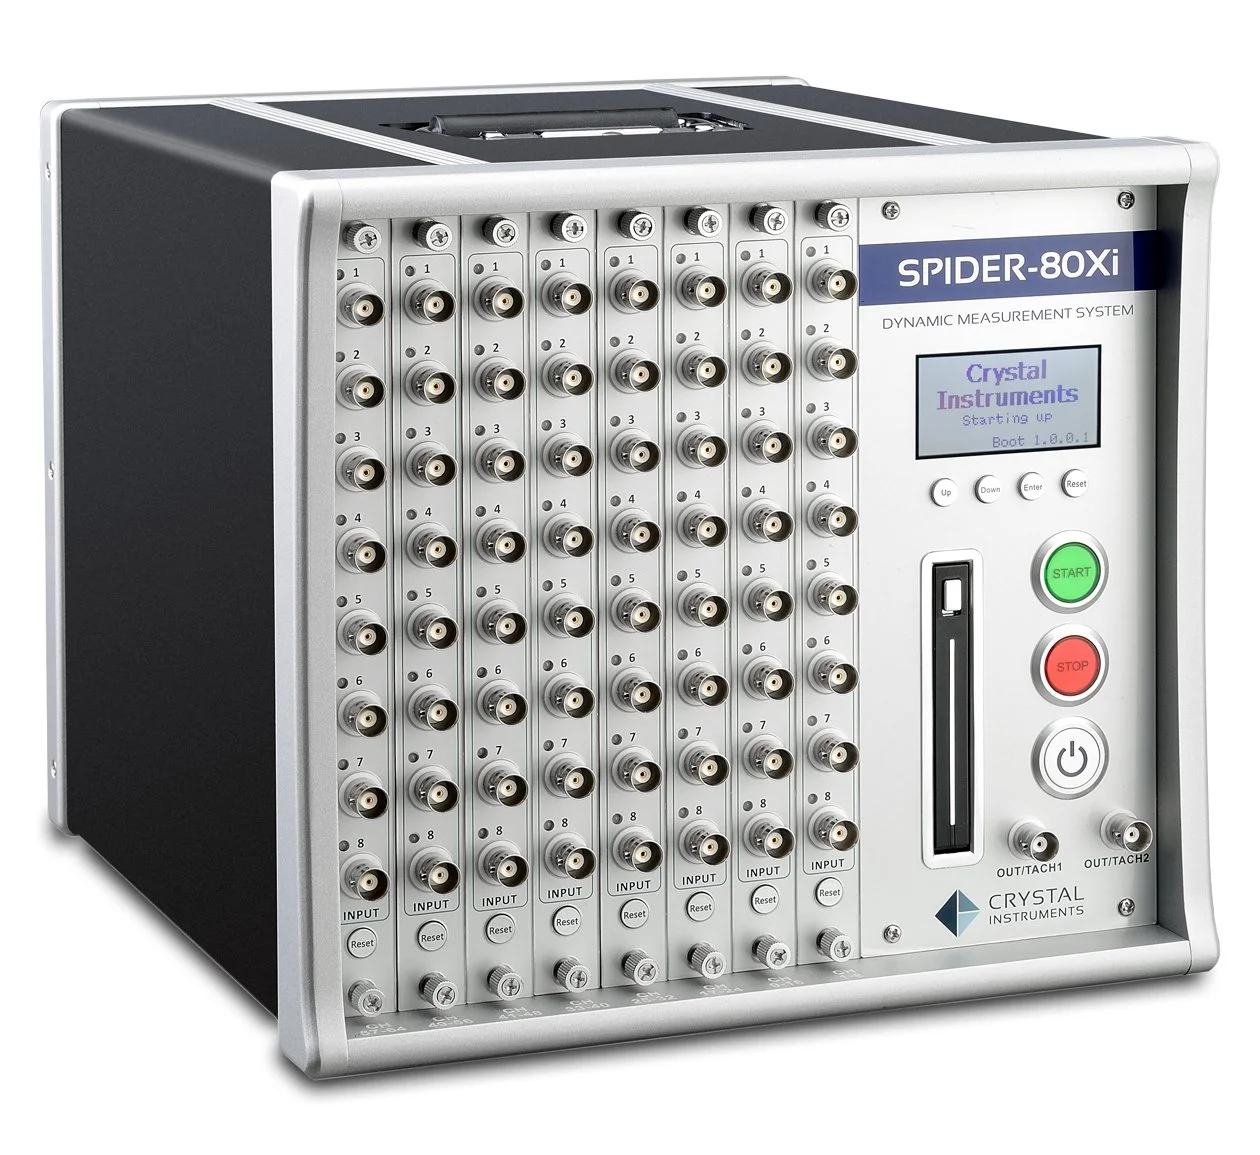
Spider-80Xi, our GPS-synchronized distributed data acquisition and analysis platform
The Phase 2 deployment ran a single chassis with 32 channels from one control point near the building's main entrance, with cabling radiating out to the roof, the windows where cracking first appeared, the entry doors, and free-field points along the fence line and parking lot. The entry doors visibly flexed on each impulse, providing a vivid confirmation that the energy reaching the building was ‘real’. And where the earlier measurement campaign ended in a spreadsheet nightmare, the synchronized system delivered channels aligned the instant they were recorded. Analysis started the same day!
What the data showed
The measured levels came in approximately “an order of magnitude higher than the launch provider's published prediction”, a finding independently supported by a third-party acoustics analysis that also predicted levels above the provider's figures. Real-world numbers replaced book values. Just as important, the data revealed genuine spatial variability in the building's response, point to point, visible only because dozens of channels were captured together on one timeline.
From investigation to standing capability
The results earned the program a bigger footprint. The contractor has expanded the system 6-systems and 224 channels, as well as a second building. This is a 130,000-square-foot multi-use facility housing sensitive assets. At more than twice the footprint of the first, the second facility sits about three and a quarter miles from the SLC-36 and SLC-40 landing sites. It was here that our customer observed large roll-up doors bouncing around when subjected to the sonic-booms of returning rockets like they were auditioning for ‘River-Dance’. The target there is a permanent, rack-mounted Spider installation with in-facility cabling.
Across the program, the customer standardized its entire measurement ecosystem on one repeatable building block: the Crystal Instruments Spider-80Xi chassis with four 8-channel IEPE cards. One configuration to document, one unit to calibrate, one system to learn, and the same module deployable anywhere. This allowed the program to expand from 24 portable channels, to 32 synchronized channels, to a 224-channel permanent installation, and beyond with a fully deployable and easily re-configurable system as the end state.
Asked why they chose Crystal Instruments, the engineering team's answer was direct: "The equipment is easy to use, the company is easy to work with, and it's built and supported here in the USA." Synchronized, distributed acquisition turned an unexplained crack into actionable data.
Brian Zatzkin, Eastern Regional Sales Manager, presented this case study at Noise-Con 2026 in Long Beach, California. To learn more about the Spider-80Xi and GPS-synchronized distributed measurement, contact Crystal Instruments.